
Introduction
This report outlines the status of ongoing Australian National Radiation Dose Register (ANRDR) projects and provides a summary of selected data from the ANRDR covering the period 2016–2025.
ANRDR upgrade
The ANRDR is undergoing a major upgrade, currently in the implementation phase. The planned upgrade will enable submissions from dosimetry service providers and allow online access to dose records for workers, employers, regulators, and administrators. The project is scheduled for completion in mid-2027.
Analysis of data
The ANRDR collects quarterly radiation dose information from multiple industries, exposure types, and dose categories. This data is used to monitor individual doses and generate annual statistics on exposure patterns. Analysis of this data informs efforts to enhance radiation protection measures for workers. Personal information collected is used to match individuals with their recorded doses and to identify personnel when dose history reports are requested.
At present, the ANRDR contains dose records for approximately 75,000 individuals, primarily from the uranium and mineral sands industries, as well as from government organisations, research institutions, and certain veterinary and medical practices.
ARPANSA notes that doses falling below minimum reporting thresholds are recorded as zero in the ANRDR, which may introduce a downward bias in statistical outcomes. Nevertheless, the applied statistical methods are consistent with those used by other national dose registers and international organisations such as the International Atomic Energy Agency (IAEA) and the United Nations Scientific Committee on the Effects of Atomic Radiation (UNSCEAR).
Variations may exist between previously published data and the data presented for the same timeframe in this report. These differences are mainly due to periodic data cleansing by ANRDR administrators to resolve duplicate individual records – when individuals were not properly identified or linked to existing records – and to address duplicate dose records for the same period related to an individual.
There have also been cases where data was submitted or resubmitted to the ANRDR after earlier analyses had been published. These updates did not significantly change the overall dose records but aim to improve the reliability of the reported analyses.
Uranium industry data
The ANRDR includes data from all licensed Australian uranium operators, maintaining exposure records for operations since 2011. Reported doses reflect received values, and dose calculation methodologies have regulatory approval within the relevant jurisdictions.
Figure 1 (below) shows trends in average and maximum effective doses among workers in the combined ‘mining’ and ‘processing’ categories. The average effective dose for these groups decreased from 0.82 mSv in 2024 to 0.77 mSv in 2025, while the maximum effective dose decreased from 5.2 mSv in 2024 to 4.9 mSv in 2025.
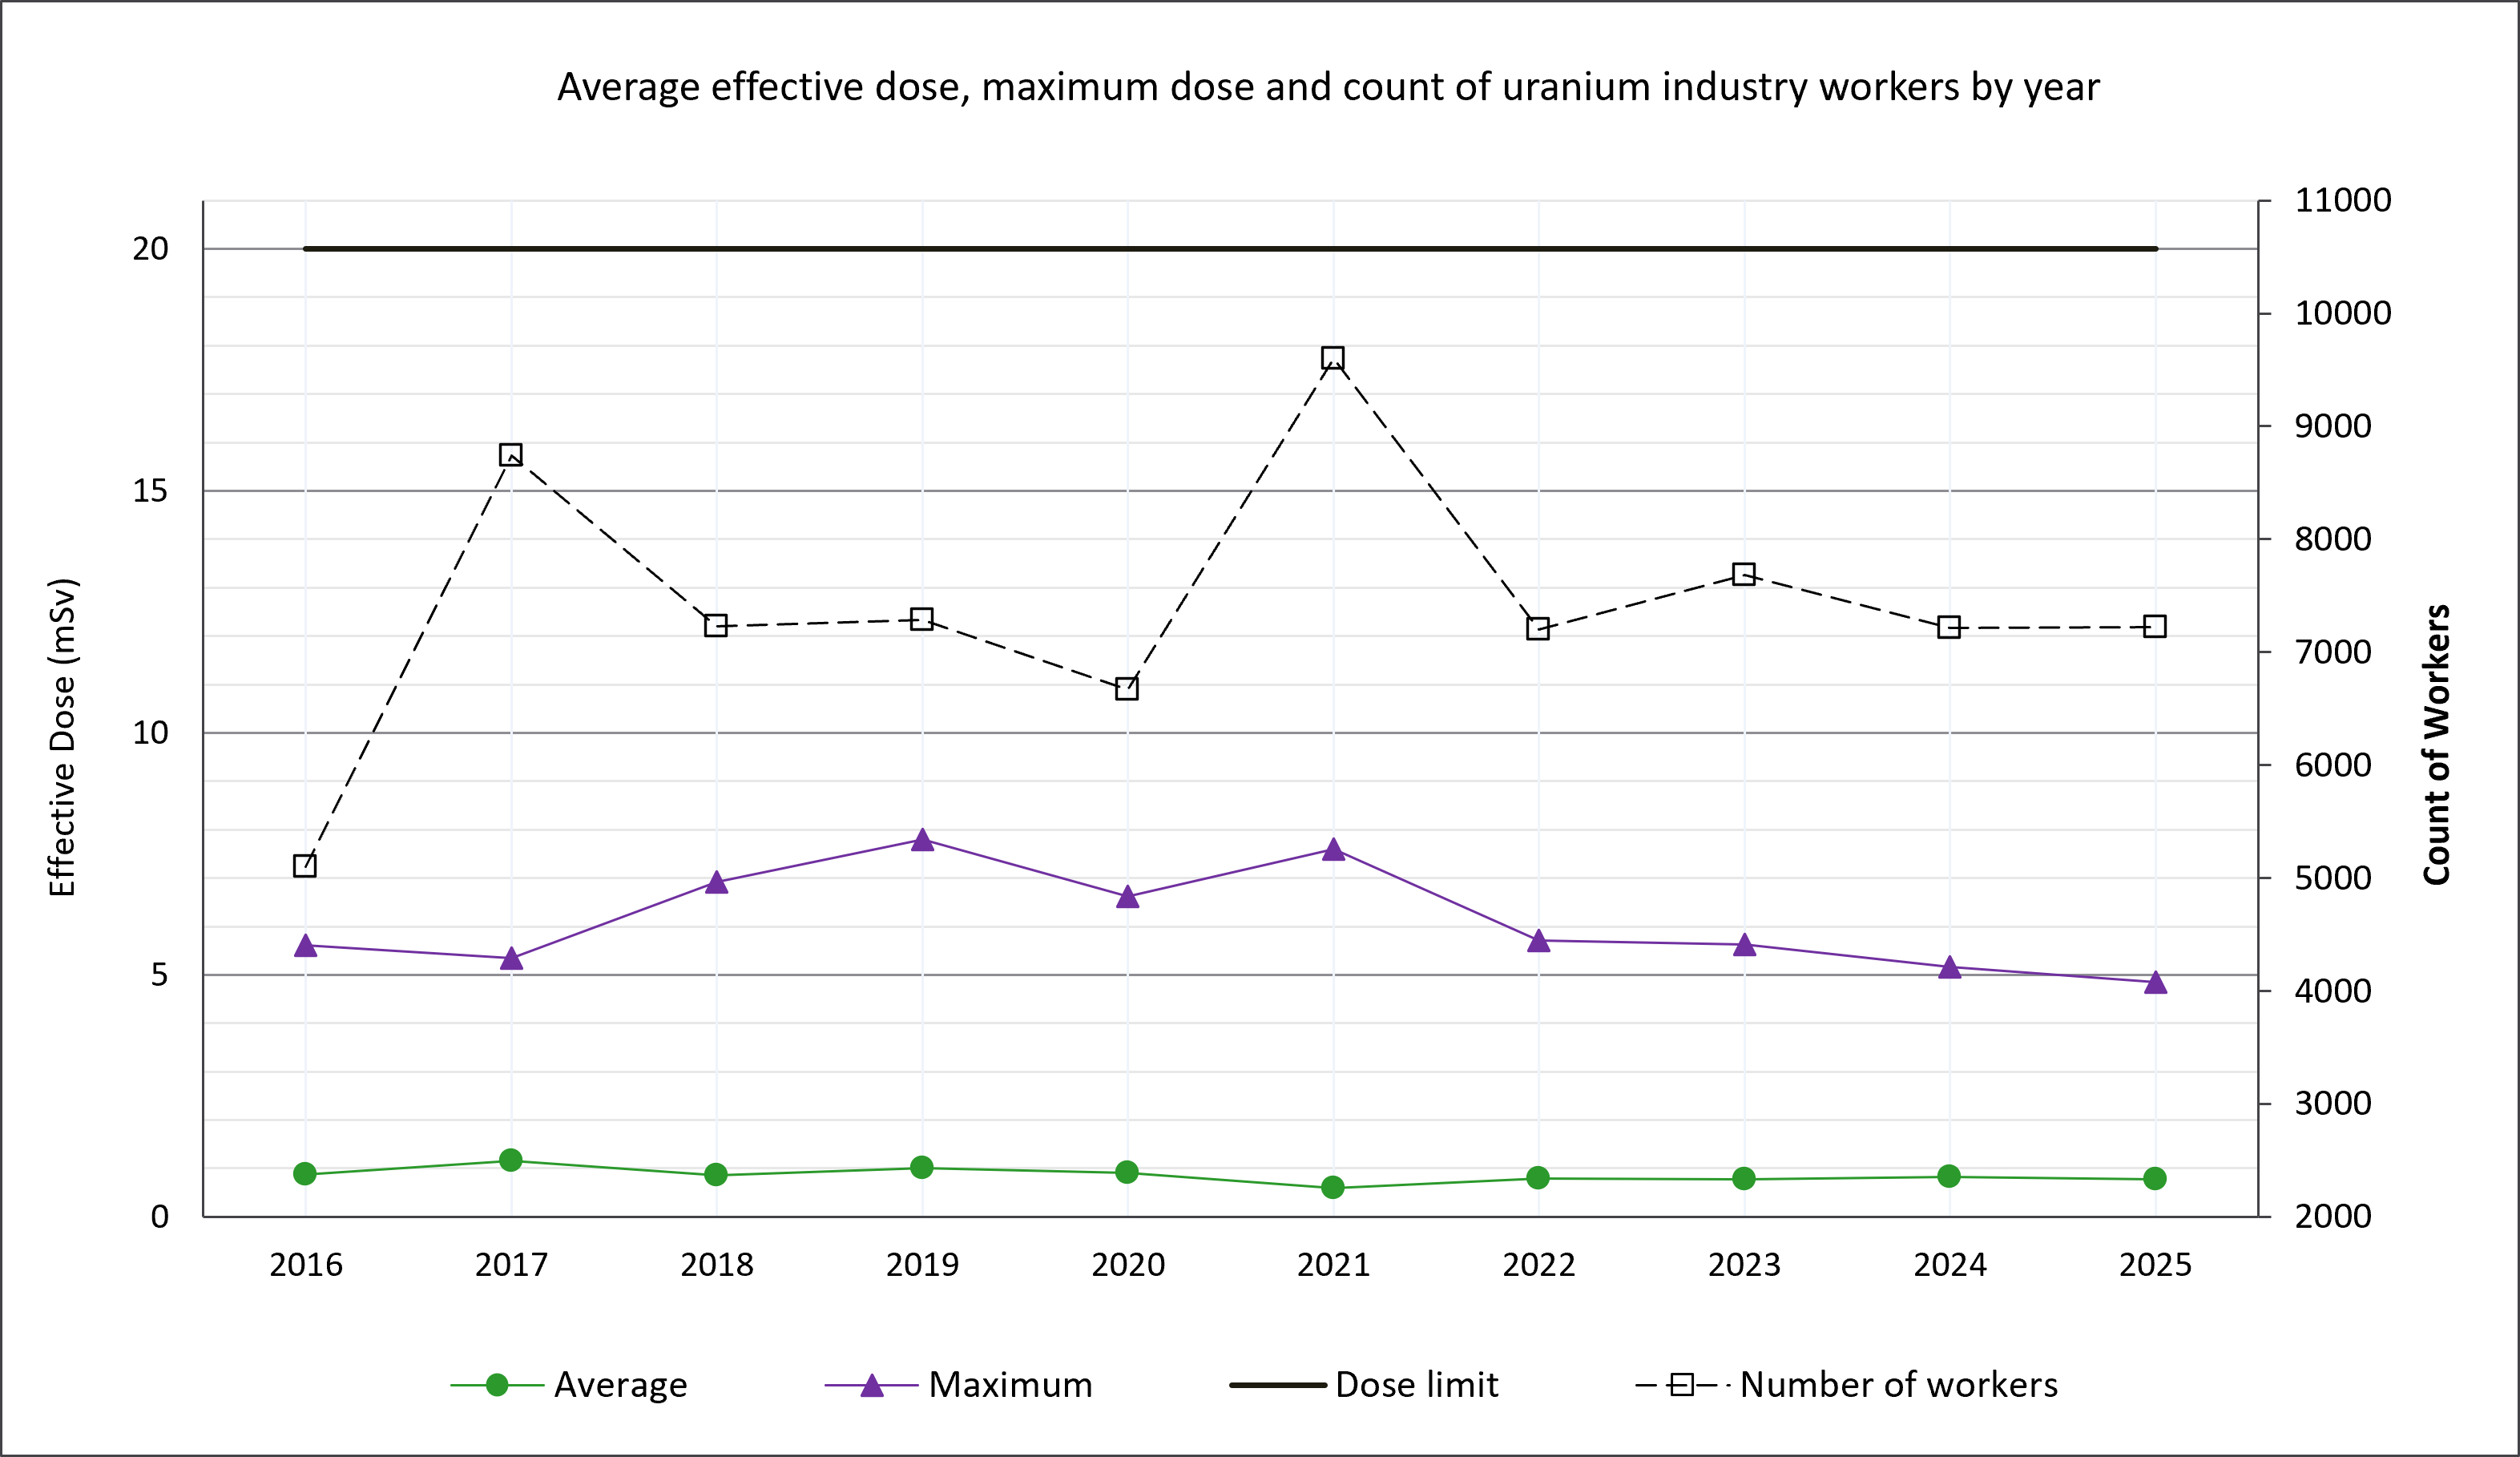 Figure 1: Uranium industry average and maximum effective doses and count of workers by year (2016 – 2025).
Figure 2 (below) displays average effective doses by work category: ‘mining’, ‘processing’, and ‘other’ (includes administrative and support staff). For miners, the average effective dose declined slightly from 1.45 mSv in 2024 to 1.43 mSv in 2025. For process workers, the average effective dose also decreased from 0.47 mSv in 2024 to 0.34 mSv in 2025. The ‘other’ category followed a similar trend to process workers, with a decrease from 0.34 mSv in 2024 to 0.27 mSv in 2025.
For these averages, any worker assigned to more than one work category within a year was placed in the category where their highest dose occurred.
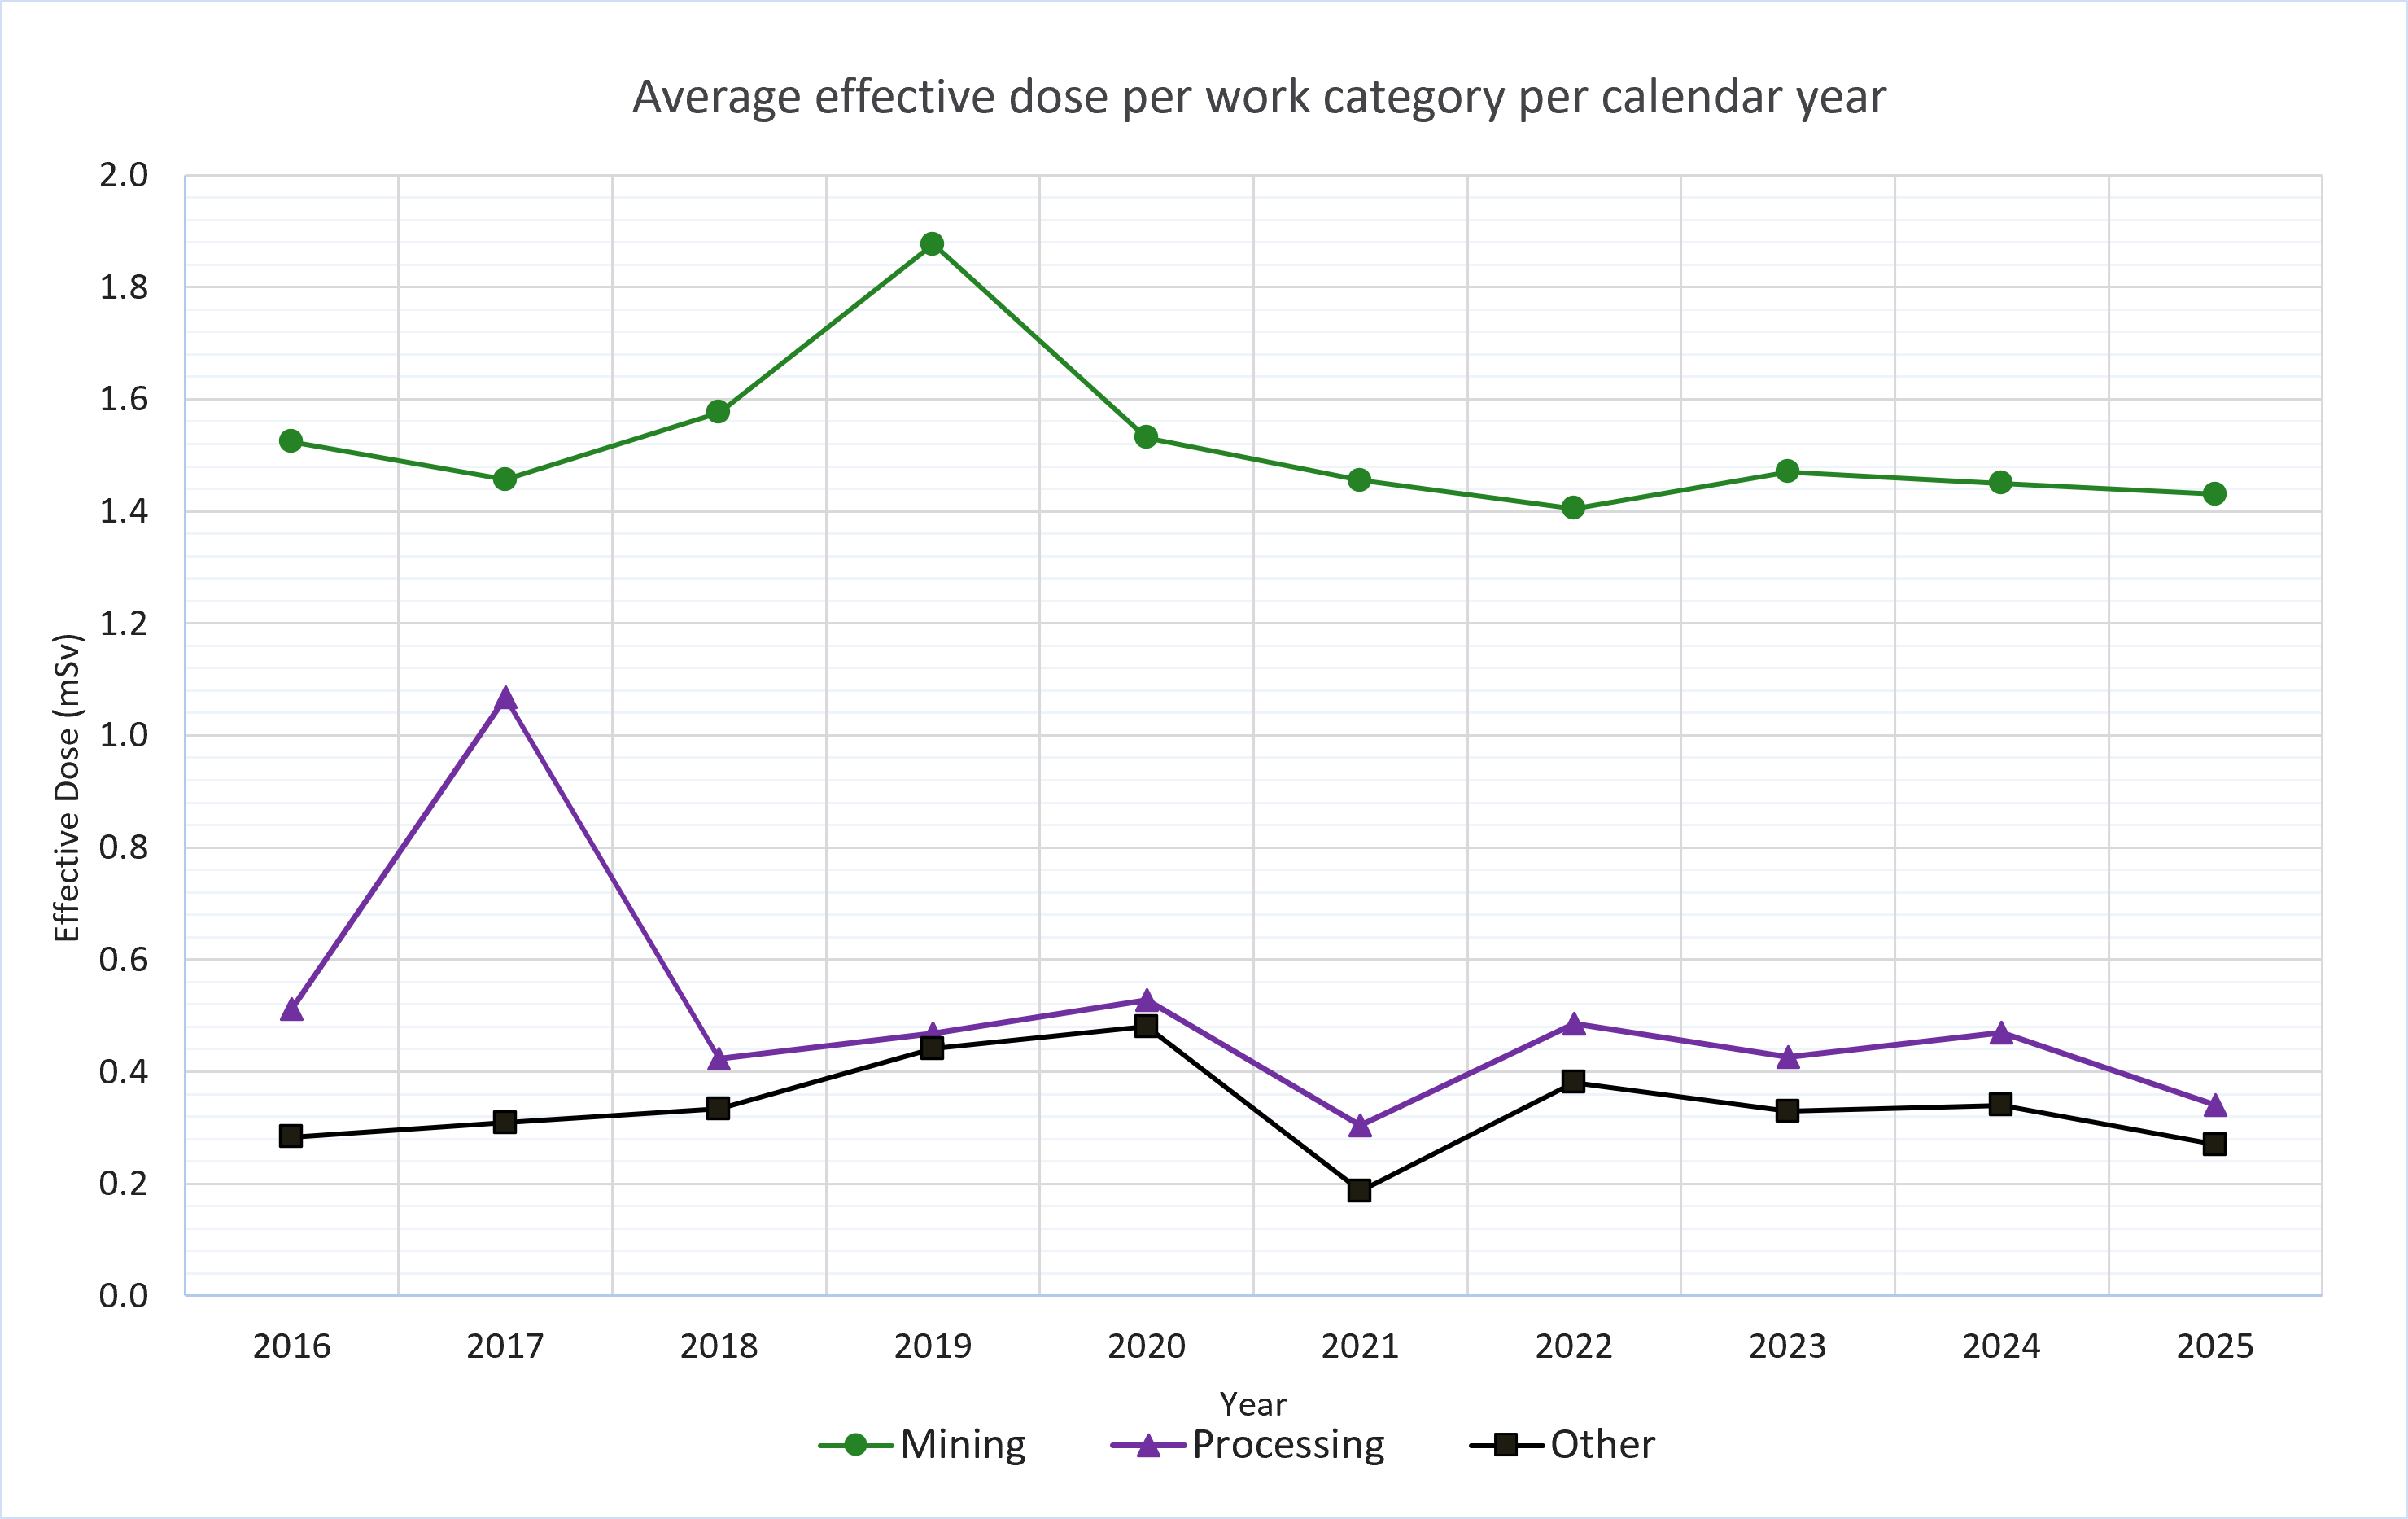 Figure 2: Uranium industry average effective doses per work category (2016 – 2025).
Exposure pathway assessment
An evaluation of exposure pathways, including inhalation of particulates, inhalation of radon progeny, and external gamma radiation, for both miners and processing workers highlights the primary areas requiring control by uranium mining operators.
As depicted in Figure 3 (below), the average effective dose for miners is predominantly influenced by inhalation of radon progeny and exposure to external gamma radiation. Since 2020, these two pathways have contributed similarly (within 0.12 mSv) to the total average effective dose, while inhalation of particulates continues to account for only a minor share.
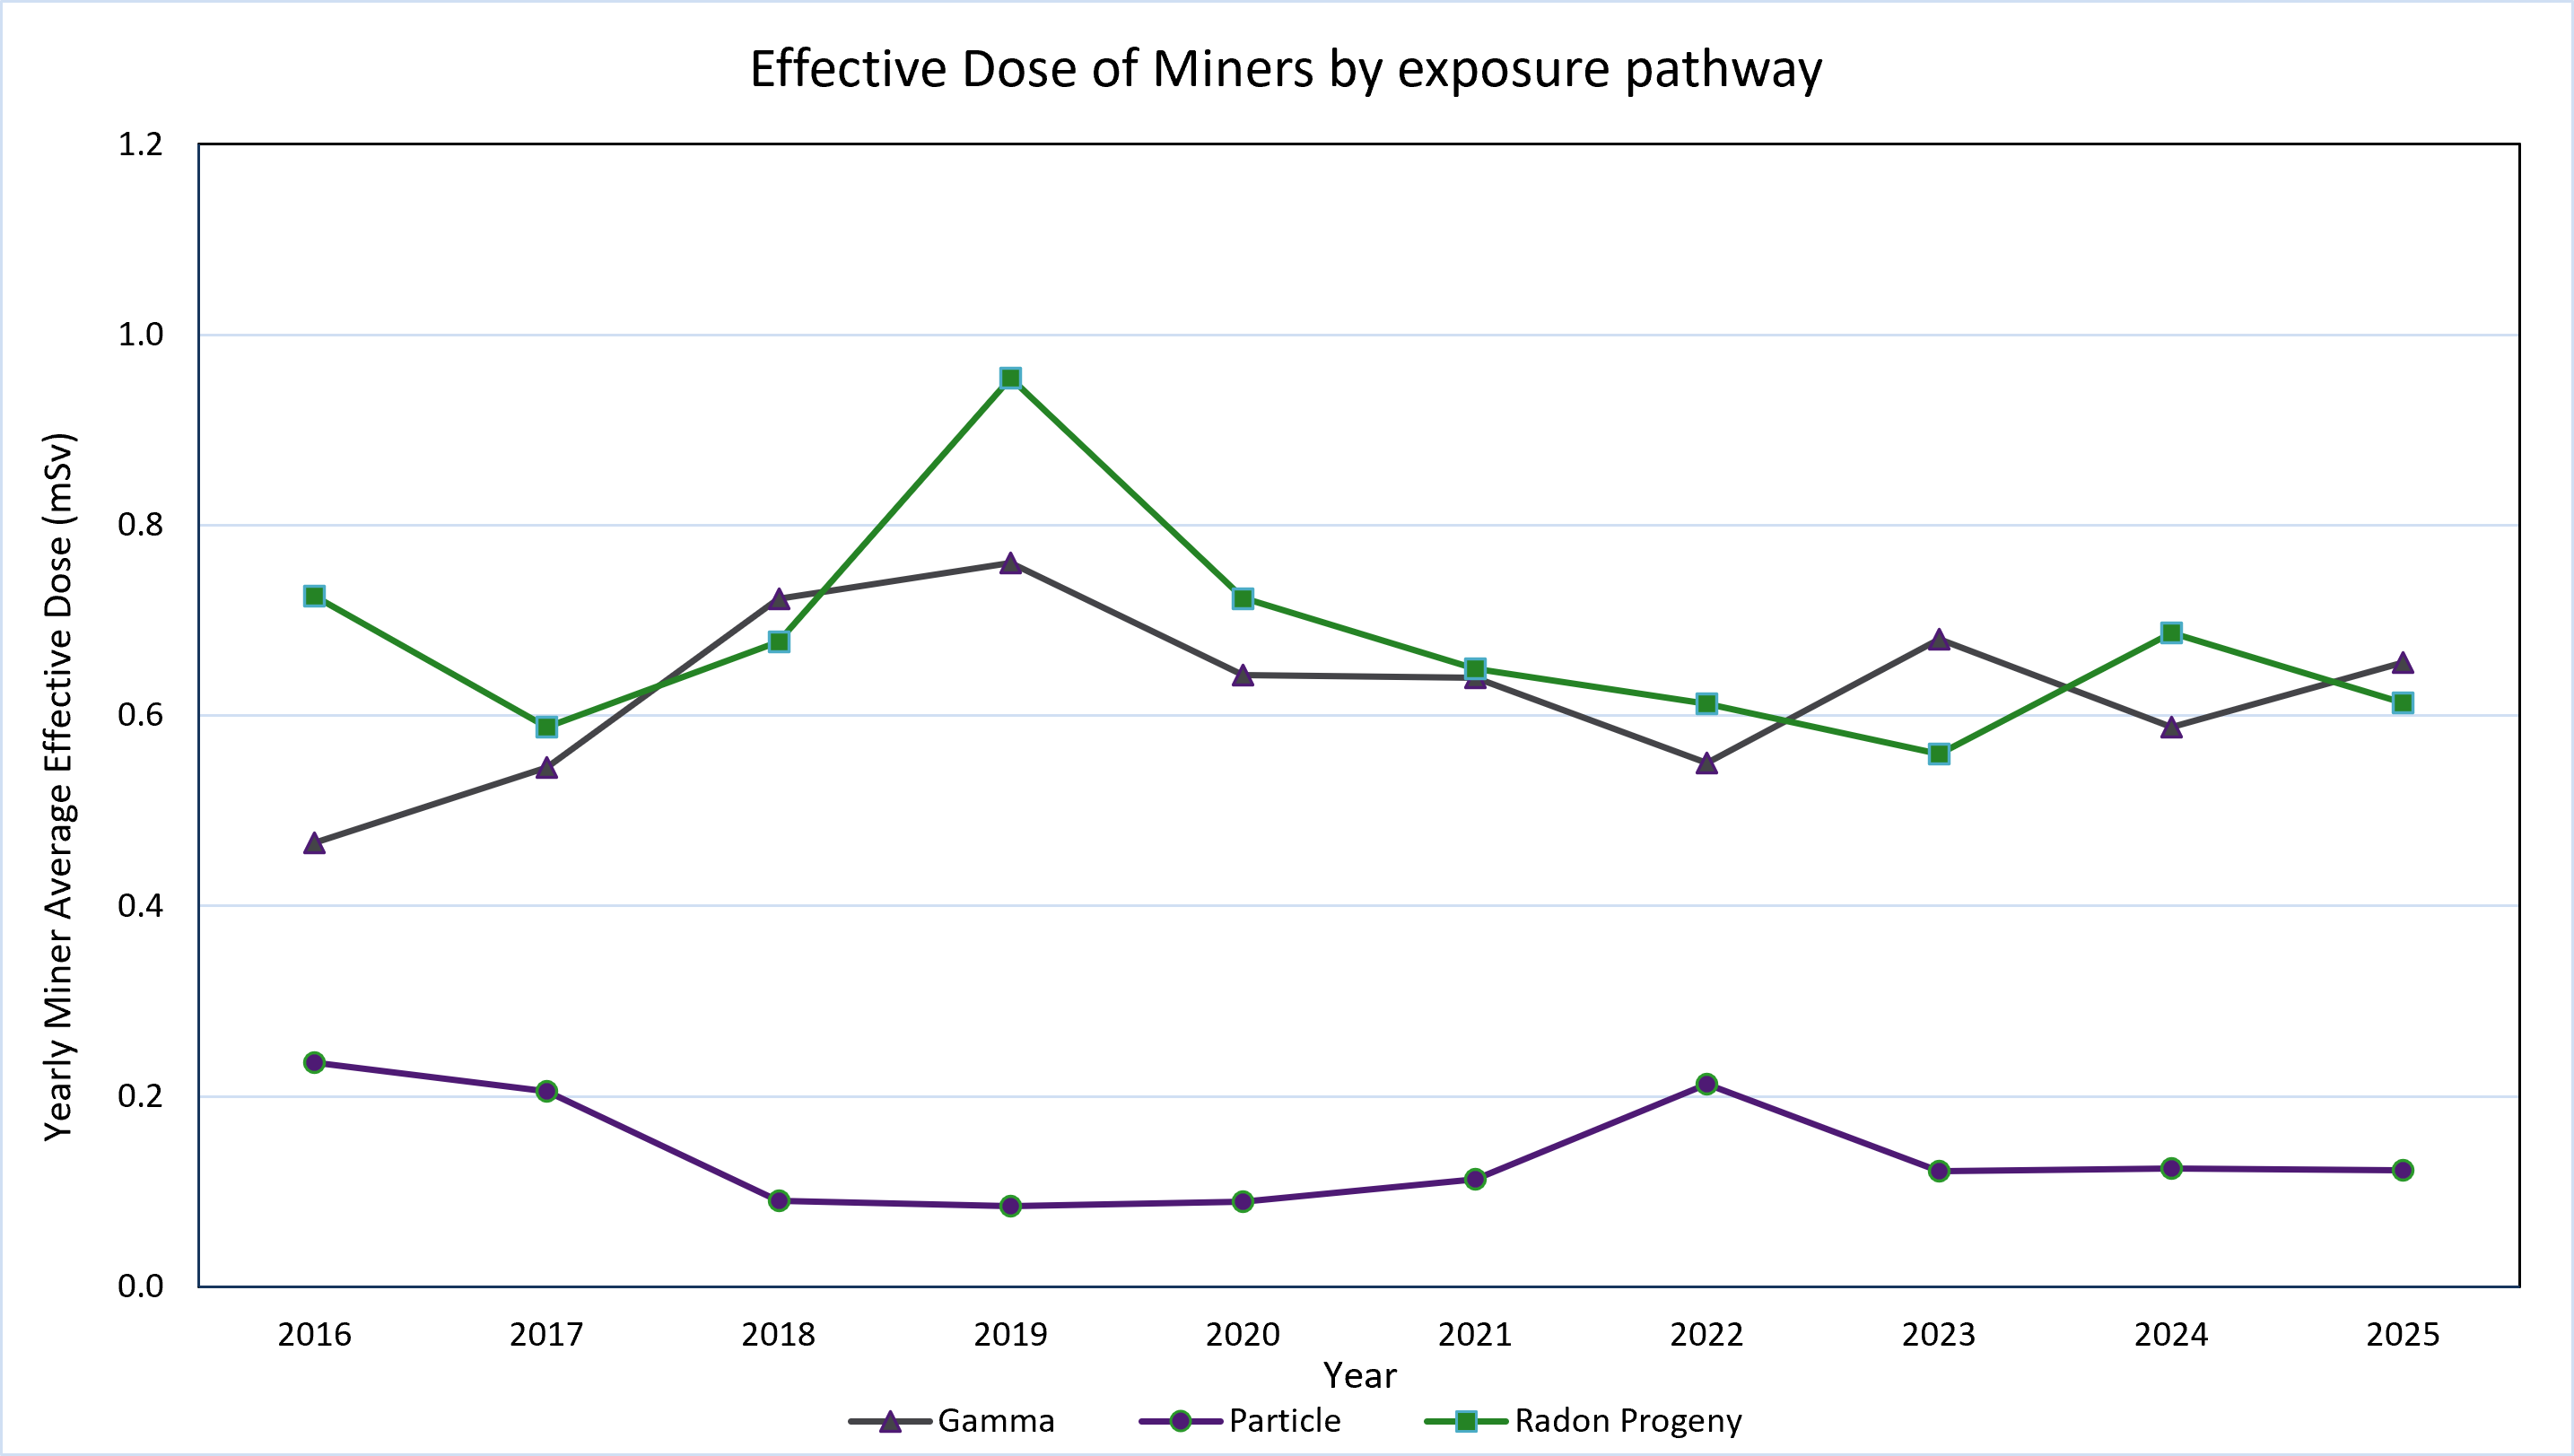 Figure 3: Miner effective dose by exposure pathway (2016 – 2025).
Figure 4 (below) presents the effective dose by exposure pathway for processing workers. While particulate inhalation was the main contributor to effective dose from 2021 to 2023, radon progeny inhalation has been the largest contributor for processing workers over the past two years. External gamma radiation exposure to processing workers remains as the lowest contributor to their exposure.
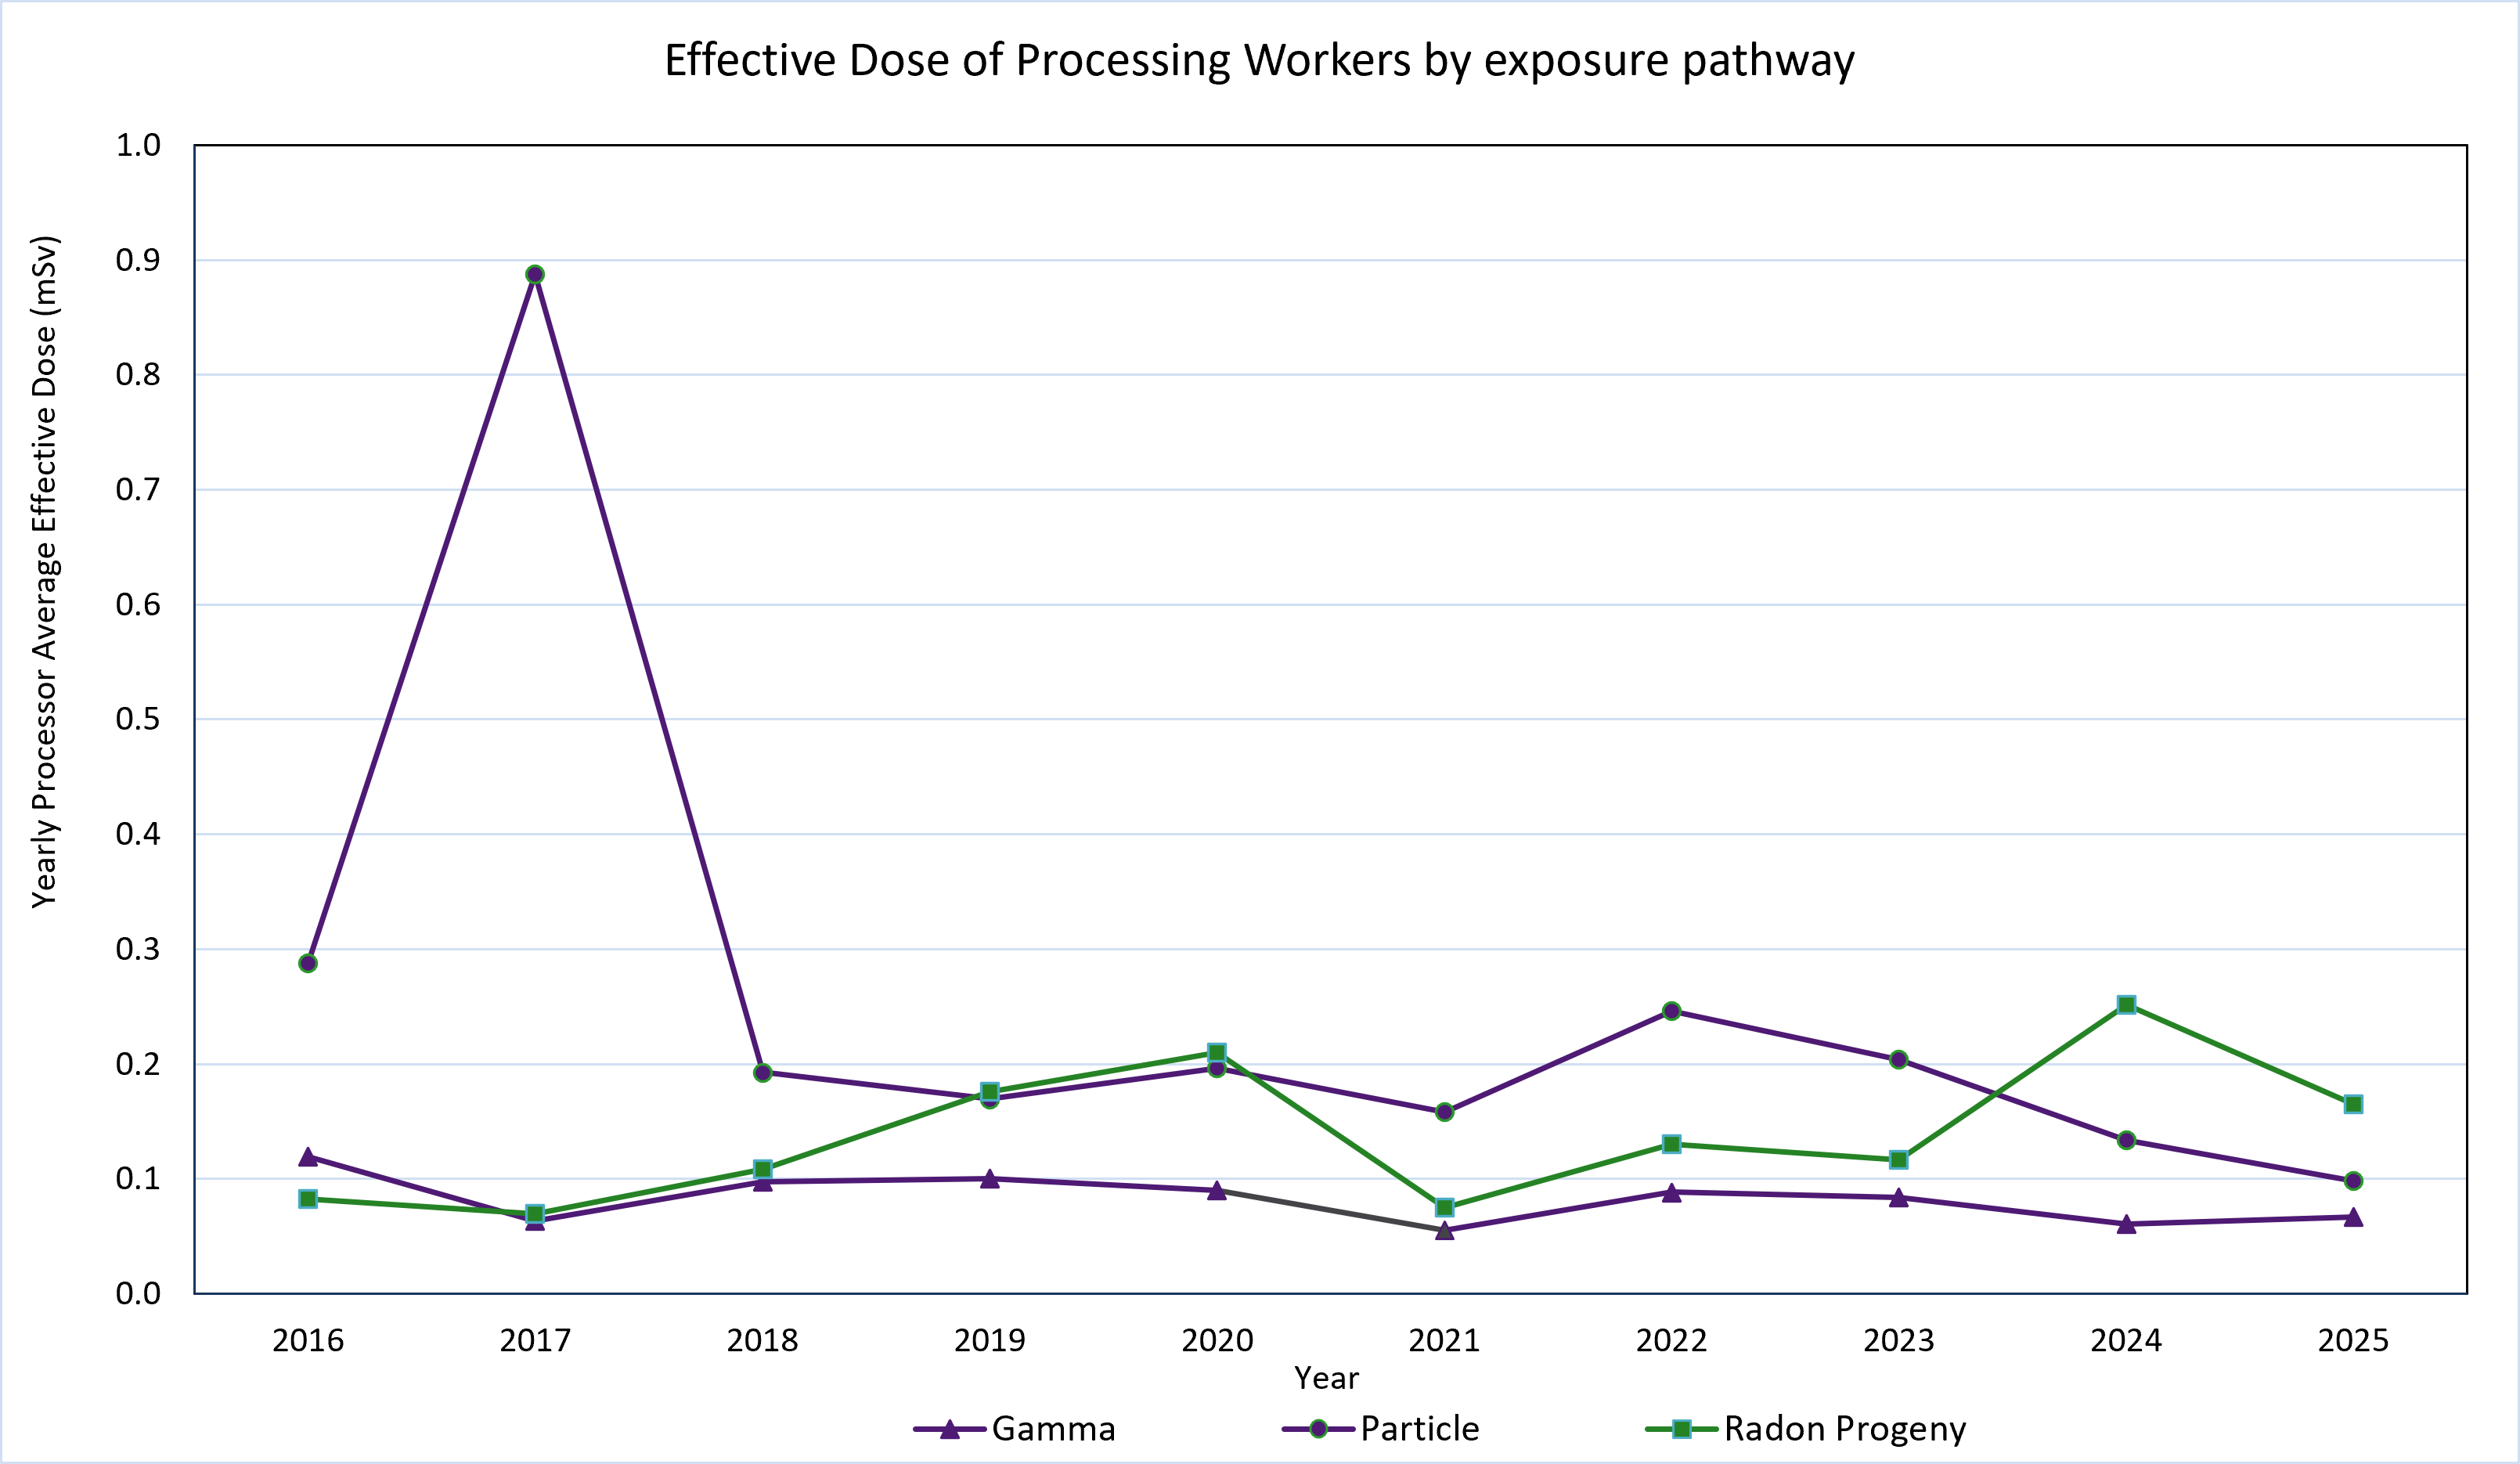 Figure 4: Processing Worker effective dose by exposure pathway (2016 – 2025).
Commonwealth licence holder data
Reported doses
Following an amendment to the ARPANS Regulations in 2017, Commonwealth organisations are required to submit dose records to the ANRDR. Consequently, data prior to 2017 is not available for analysis.
The four largest submitting organisations are the Australian Nuclear Science and Technology Organisation (ANSTO), the Commonwealth Scientific and Industrial Research Organisation (CSIRO), the Australian National University (ANU), and the Australian Radiation Protection and Nuclear Safety Agency (ARPANSA).
These organisations include scientific and university researchers, regulatory authorities, nuclear installations, and other source licence holders. For this review, the work categories ‘scientific research’, ‘university research’, ‘nuclear facilities’, and ‘miscellaneous’ have been used to group Commonwealth licence holder workers; ‘miscellaneous’ encompasses regulators and other source licence holders.
Figure 5 (below) presents the average effective dose per year for each category from 2017 to 2025. It should be noted that for the 2025 calendar year the number of workers listed as ‘miscellaneous’ fell from approximately 60 to zero, while the number of ‘university research’ workers grew by the same amount. This indicates that some workers may have been re-classified, or possibly miss-classified, by their originating organisation this year.
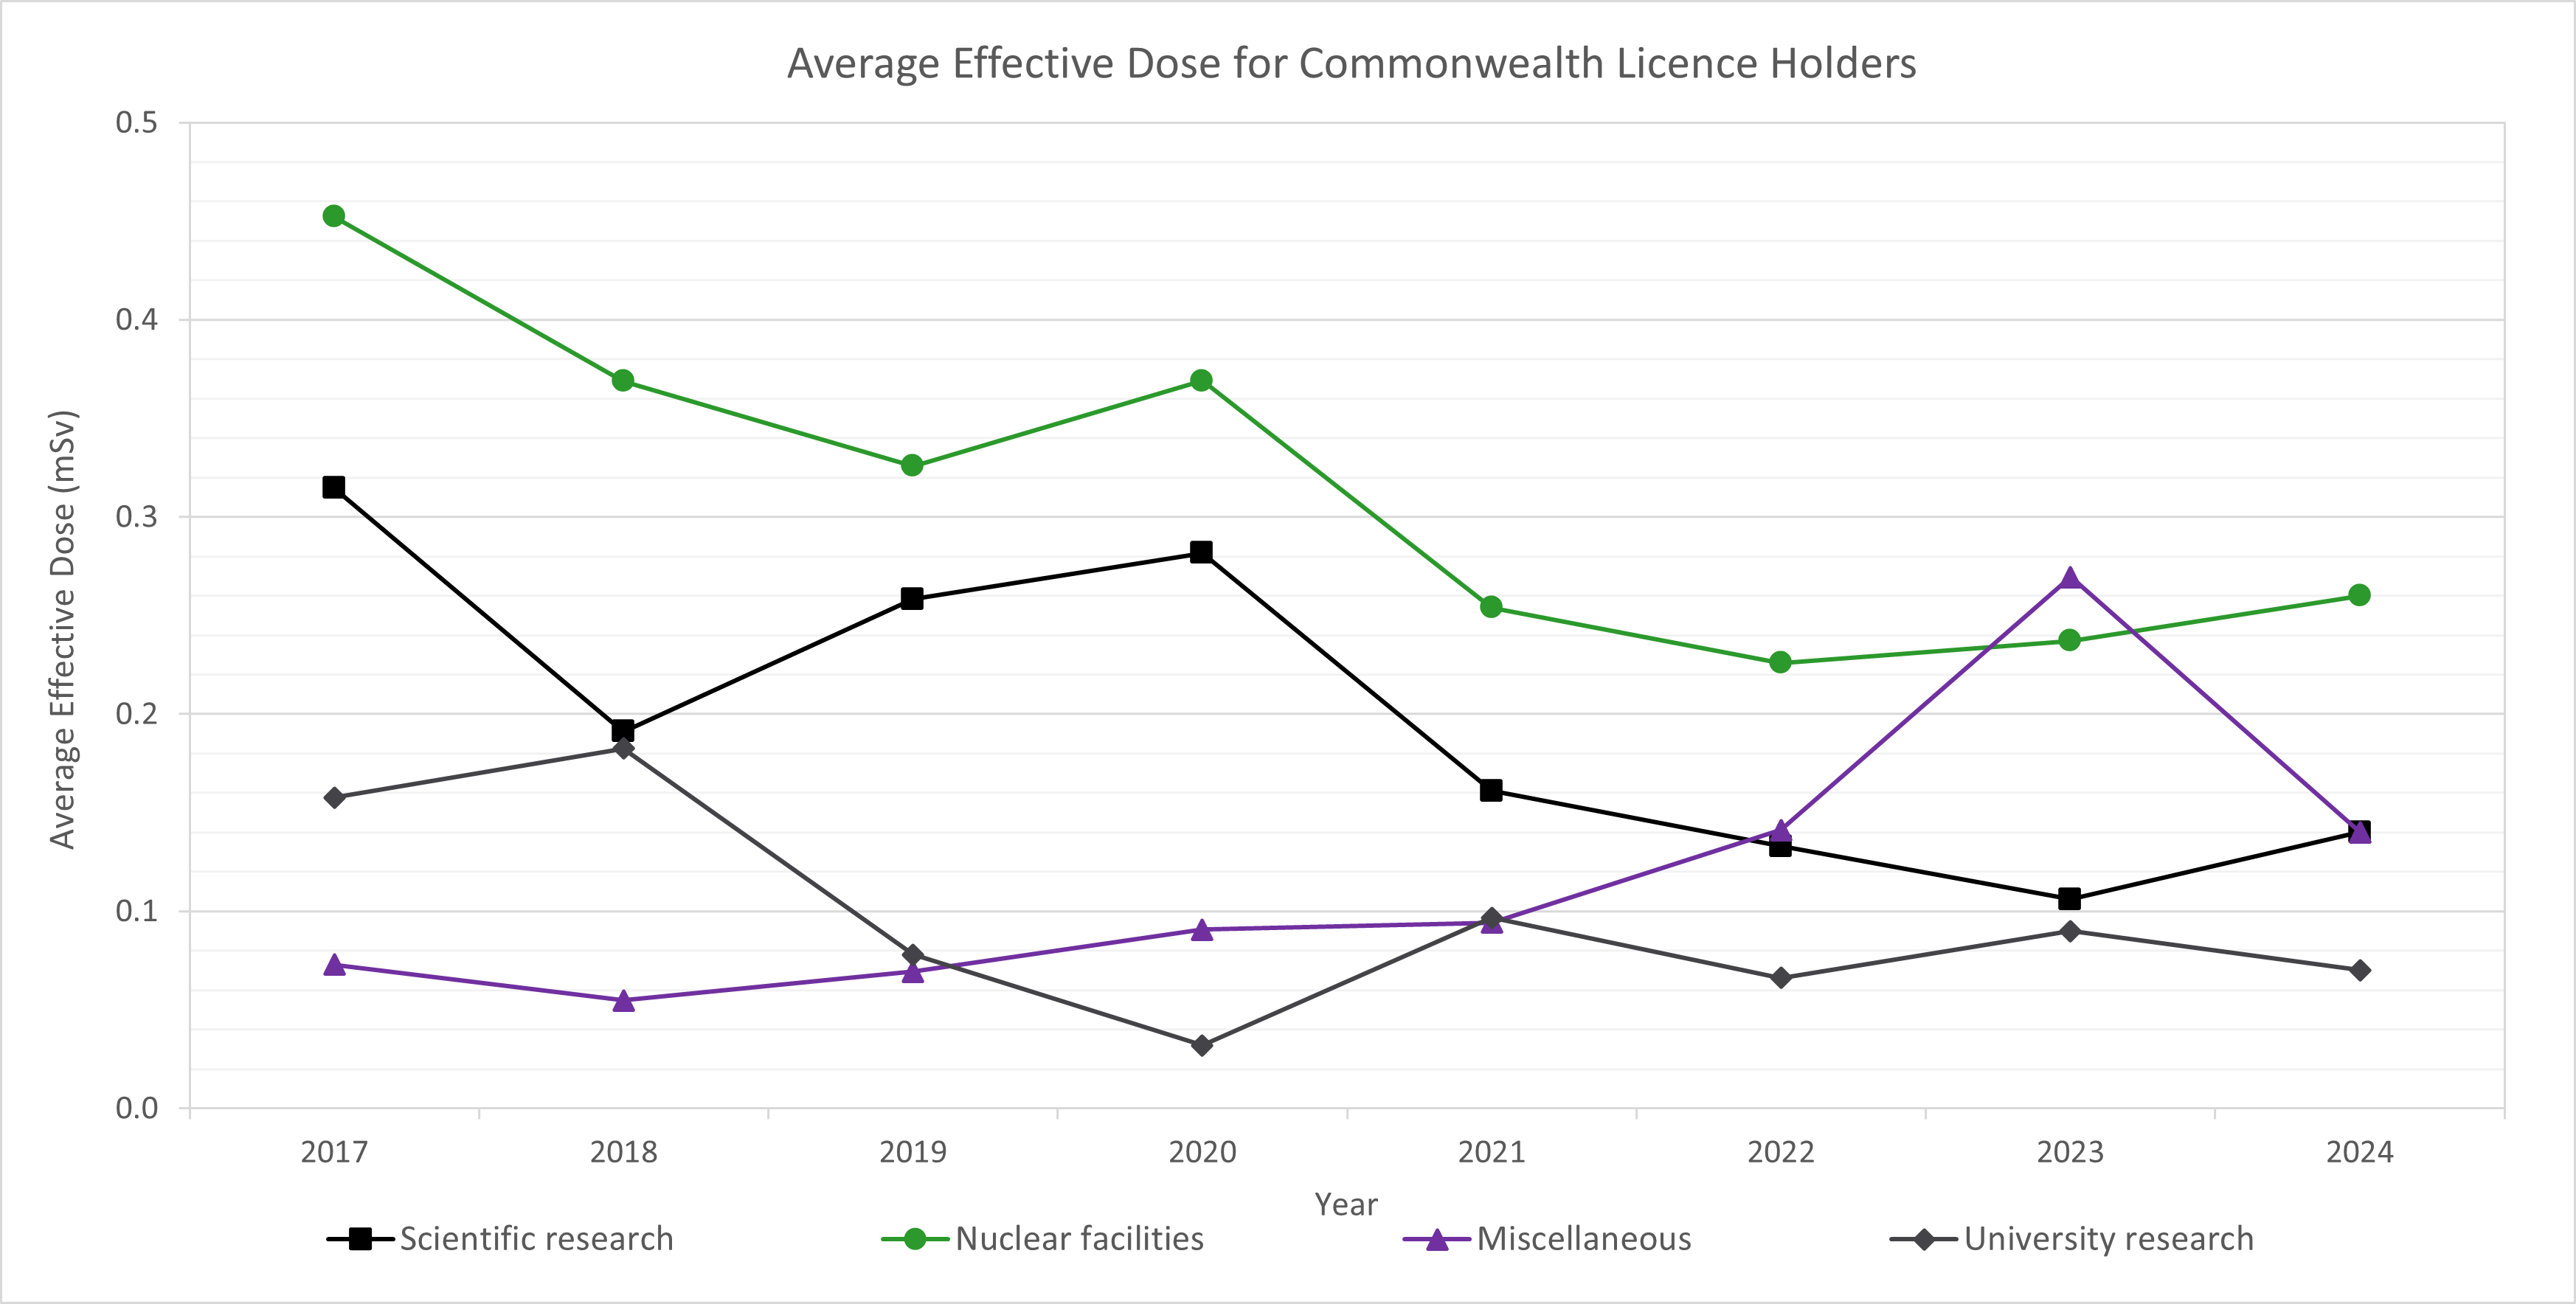 Figure 5: Average effective dose for Commonwealth licence holders 2017 - 2024
Top 100 doses for Commonwealth organisations
Review of the top 100 doses from submitting Commonwealth organisations helps regulators to tailor their inspection regime and to facilitate discussions with their licence holders. The top 100 doses from Commonwealth organisations for the years 2021–2025 are provided in Figure 6 (below). The maximum and average doses, from the top 100 doses for each year since reporting commenced, are presented in Table 1 (below).
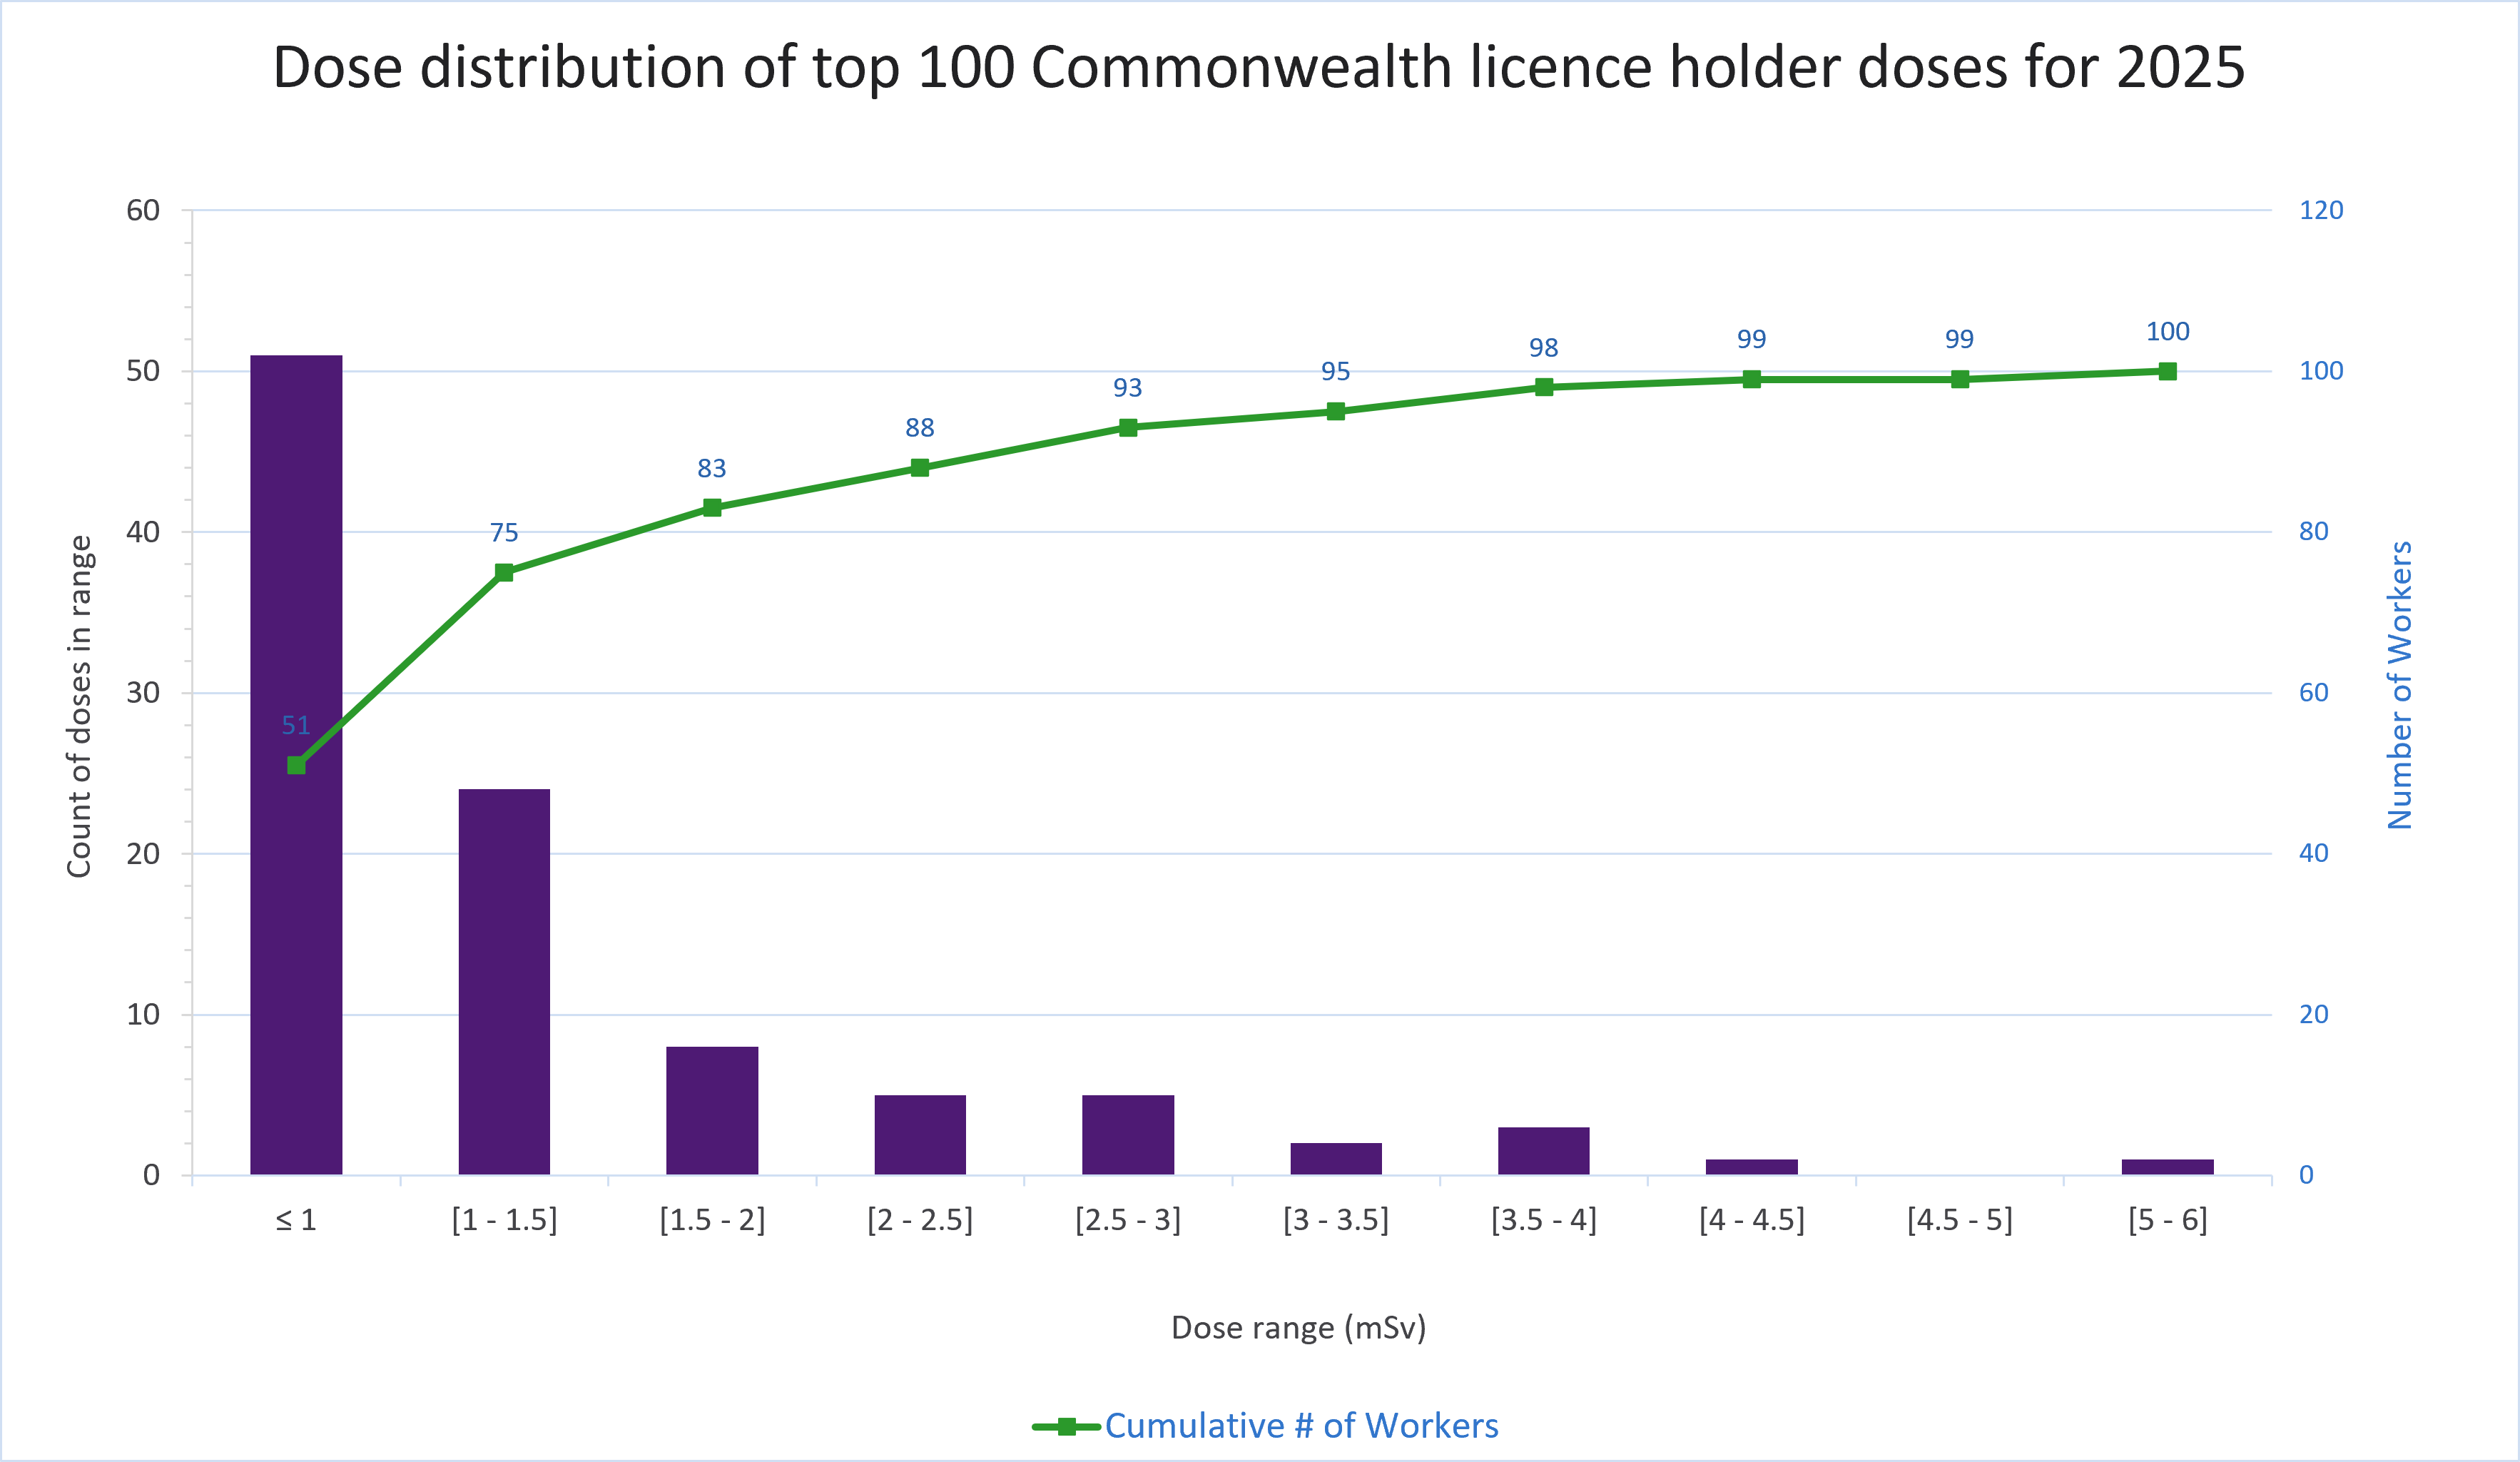 Figure 6: Dose distribution of the top 100 doses from participating Commonwealth licence holders 2025.
2021 | 2022 | 2023 | 2024 | 2025 | |
| Maximum (mSv) | 4.29 | 4.68 | 5.86 | 4.35 | 4.28 |
| Average (mSv) | 1.40 | 1.39 | 1.47 | 1.30 | 1.36 |
Table 1: Dose statistics for top 100 doses from Commonwealth licence holders for 2021 – 2025
All workers
Dose distribution
The data from all organisations submitting to the ANRDR has been analysed to produce dose distribution histograms for 2025; that histogram is presented in Figure 7 (below). This is an effective way to demonstrate the distribution of occupational exposures and can minimise the impact of data skewing for doses that have been reported as less than the minimum reportable dose (< MRD).
The maximum and average effective doses for all workers in the ANRDR for the year 2025 are presented in Table 2 (below).
2025 | ||
| Maximum (mSv) | 4.60 | |
| Average (mSv) | 0.50 |
Table 2: 2025 dose statistics for all workers.
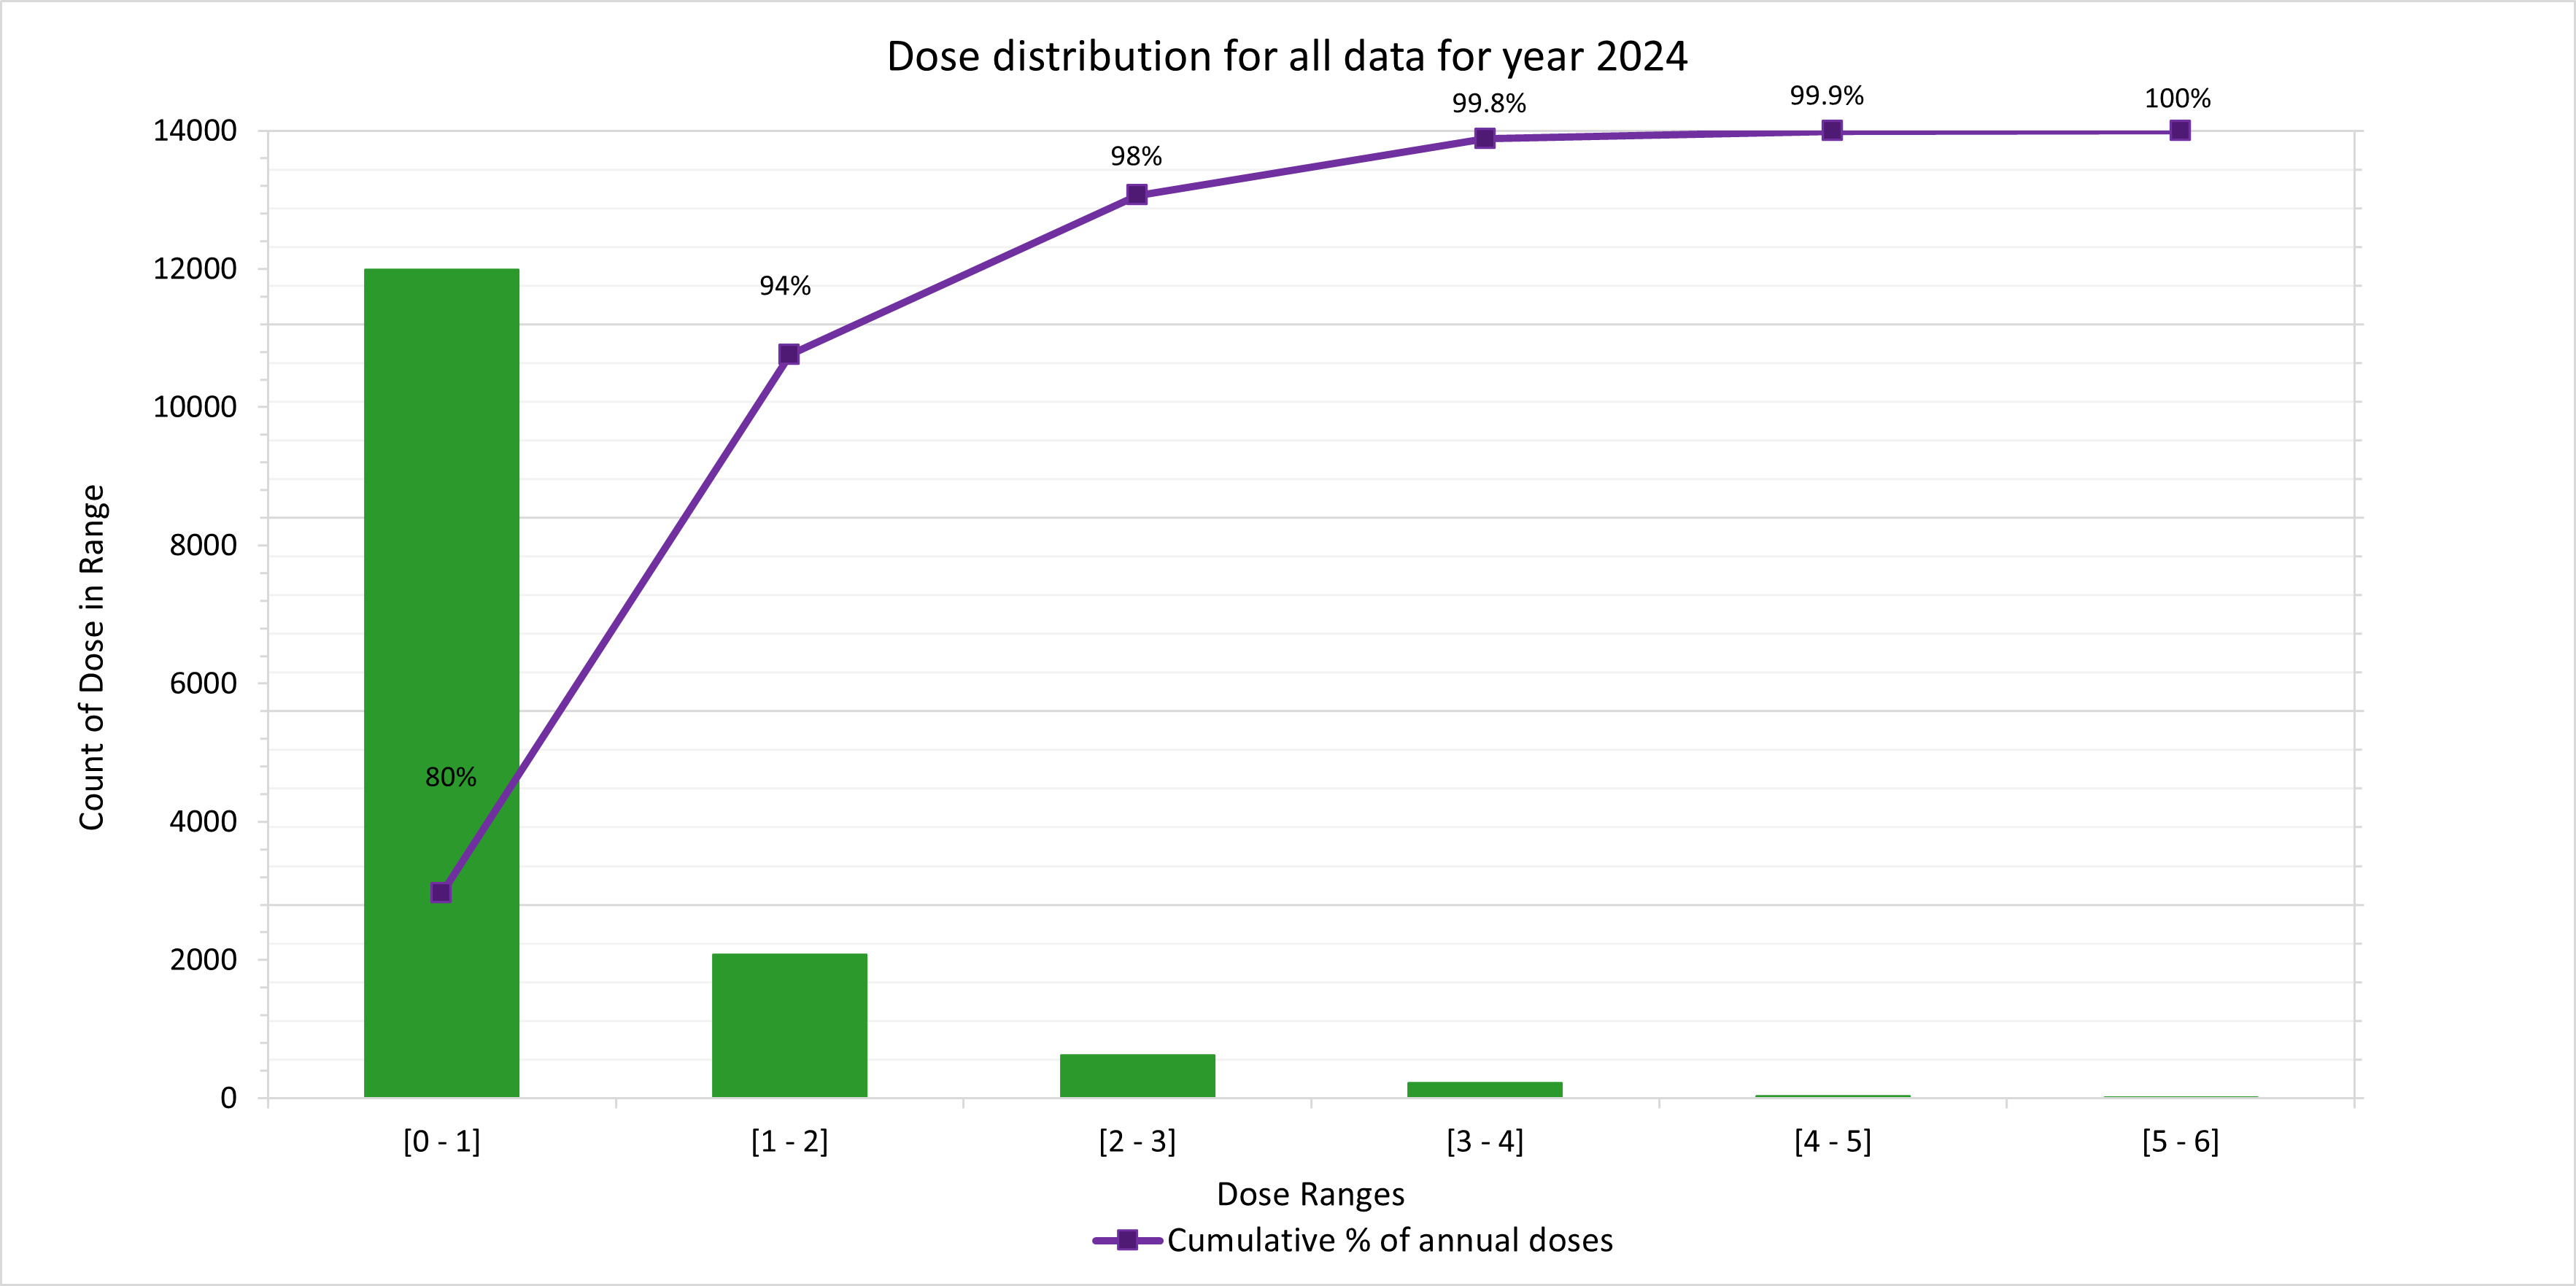 Figure 7: Dose distribution for all worker records for 2025.
Analysis of the cumulative frequency of the doses reported to the ANRDR for 2025 shows that approximately 84% of workers received a dose less than 1 mSv and 99% received a dose less than 3 mSv. These values are well below the occupational exposure limit of 20 mSv per year. No reported worker doses exceeded half of the occupational exposure limit.
Conclusion
The ANRDR maintains complete coverage of occupational radiation exposures for the uranium mining industry as well as collecting doses for a range of Commonwealth licence holders. In relation to those workers working in the uranium mining industry or for relevant Commonwealth license holders, the data shows that maximum and average occupational radiation exposures are below the annual dose limit of 20 mSv per year. Furthermore, the data shows that for these workers, occupational exposure to ionising radiation in Australia is well controlled.