What is an Environmental EME Report?
The Environmental EME Report provides calculations of the maximum levels of radiofrequency (RF) electromagnetic energy (EME) around an existing and/or proposed wireless base station that may include mobile telephony, broadband and data services. The report is generally produced by qualified personnel of the network operators (such as a mobile phone company) or consultants working on their behalf.
Most mobile telecommunications infrastructure in Australia, which includes wireless base stations, small cells and antennas, are carried out according to the Industry Code C564:2025 Mobile Phone Base Station Deployment (the Code). The Code requires the supply of certain information as part of the consultative process with the local community and local government authorities. The environmental EME report is part of this information and is produced according to a methodology developed by the Australian Radiation Protection and Nuclear Safety Agency (ARPANSA). It provides objective estimates of the maximum levels of EME from a wireless base station or small cell for both existing and proposed upgrades to telecommunications systems at the site. The environmental EME report is not designed for indoor facilities, stadiums, or areas with localised coverage like train stations, airports, road tunnels etc. EME levels at these facilities are assessed as part of the site compliance report and compliance certificate.
Why is there an EME Report?
The EME report provides information to the community on their exposure to RF EME from wireless technology infrastructure to demonstrate that it is below the exposure limit in ARPANSA’s safety standard.
What information is on the report?
The report gives the address of the installation, together with a list of the companies using the site and the types of mobile network currently installed and proposed. The report estimates RF EME from all of the identified mobile telecommunications wireless transmitters at this site; it does not estimate RF EME from all surrounding sites and from broadcast services like television and radio.
EME Levels
The table of calculated EME levels in the report lists the maximum levels of EME
- at 1.5 m above ground level within 500 m of the site (Environmental EME Level)
- over a range of heights at specific locations (Areas of Interest).
The values of EME are presented as a percentage of the ARPANSA Standard.
When expressed as a percentage, a value of 100% corresponds to the general public exposure limit. For example, a typical highest value of 10% means that the total EME level from all wireless network transmitters on the site, all operating at their maximum power, will be no more than one tenth (1/10) of the limit set by the ARPANSA Standard for members of the public.
Areas of Interest
The Code requires the mobile network companies to take account of community sensitive locations. The Code defines community sensitive location to include land uses such as residential areas, childcare centres, schools, aged care centres, hospitals , which may be considered as sensitive uses in some communities.
Community Sensitive Locations could be expected to include nearby multistorey buildings. For some sites there may be no indication for other areas of interest, such as where there is flat ground, no elevated buildings and no locations identified as being of particular community concern. In these cases, after checking:
- the Code’s community consultation plan
- topography or buildings near the antennas
- other locations, such as those identified as being of significant previous community concern
no other areas of interest will have been identified. In this case, the EME Report should include the statement 'No locations identified' in the 'Calculated EME levels' table.
Can I expect to have an EME calculation done for my house?
The Environmental EME report is a basic report, members of the public are free to request (in writing) a Carrier to provide additional information under the Communications Alliance Ltd Industry Code, Section 10.3 Additional Information Supplied by Carrier. The Carrier will choose how best to service that request.
Why do the EME levels vary with distance?
The calculations of the maximum EME levels are based on well established principles of physics that deal with how electromagnetic waves travel and spread out. The total amount of energy emitted from the antenna is limited by the power of the amplifier used to drive the antenna. As the energy leaves the antenna, it spreads out to cover bigger and bigger areas and so gets less intense the further away it gets, this is illustrated in Figure 1 which shows a basic 2-dimensional view of what happens to the EME around a real base station.
The antenna is usually designed to direct most of the energy out towards the horizon, or a few degrees below, so that most of the energy goes where it is needed to communicate with the mobile phone handsets or other user equipment. As one moves away from a base station at ground level, the levels first increase before reaching a maximum and then get less as you move still further away. Typically, the maximum EME level at ground level will occur between 75 m and 200 m from the base of the antenna.
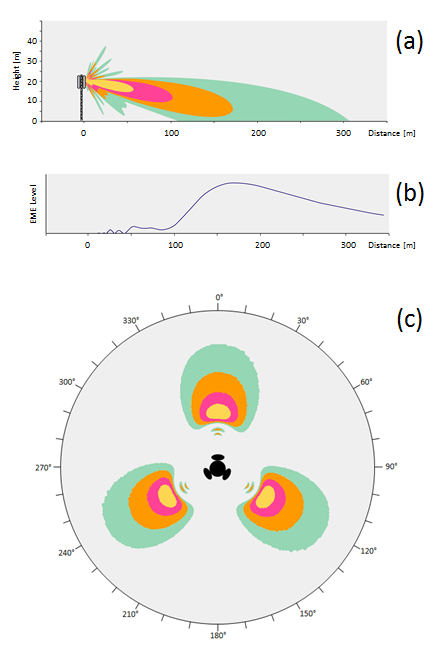
Figure 1. How the EME levels vary as you move away from a base station tower.
(a) Side view of a single antenna pattern. (b) EME level at 1.5 m above ground. (c) Aerial view of three sector antenna pattern
The EME transmitted from small cells is more localised and, depending on its configuration, may not follow the same emission profile as a larger base station. Typically, the EME levels are very low and they decrease rapidly with distance away from the source much like the larger base stations.
How Accurate are the Calculated Values?
The values of EME provided in the report are intended to be maximum levels.. The values assume, for example, that all the planned transmitters are installed and are all operating at maximum power. Some of the transmitters at a base station are only used when there are a certain number of telephone calls or data transmissions actually in progress; otherwise they are not active. Even when a call is in progress, the power transmitted is adjusted to be only as high as necessary to communicate with the handset. If the handset is close, or in a good signal area, the base station transmitter will reduce its power automatically.
The calculations do not take into account trees, vegetation or buildings which may alter the EME levels, generally decreasing them.
Measurements around base stations have shown actual values of EME are usually far less than calculations. Values of EME indoors will typically be even lower as walls, windows and roofs absorb or reflect the energy.
A similar situation applies to the emissions from small cells. The EME emissions from small cells follow the same physical process and are similarly affected by surrounding objects.
Example of Calculated EME Levels
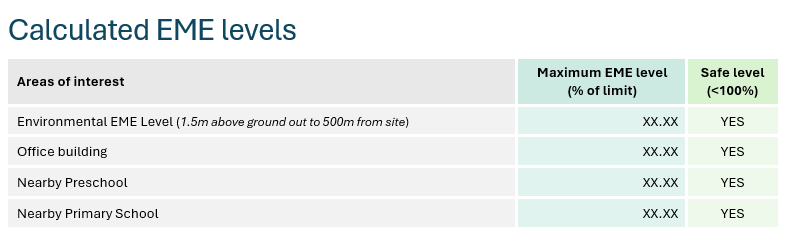
The example table above shows what is usually included in the calculated EME levels.
The table provides calculated levels of RF EME near the base station as well as at locations considered to be of special community interest or at elevated locations where there may be concern about higher levels of EME. The calculations include all existing and any proposed mobile telecommunications systems for this site. This table is included in reports for both wireless base stations and small cells.
Further Information
Information about RF EME can be accessed at the ARPANSA website:
The procedure used for the calculations in the Environmental EME report are documented in Radio Frequency EME exposure levels - prediction methodology:
The Australian Communications and Media Authority (ACMA) regulates mobile telecommunications to ensure that new and existing telecommunications infrastructure complies with ARPANSA’s safety limit: https://www.acma.gov.au/
The Communications Alliance Ltd Industry Code C564:2020 Mobile Phone Base Station Deployment is available from the Communications Alliance Ltd website: https://commsalliance.com.au.
Contact details for the Carriers (mobile network companies) operating in Australia and the most recent version of each site’s Environmental EME Report are available online at the Radio Frequency National Site Archive: http://www.rfnsa.com.au
Current version
The Environmental EME Report template was updated in 2024. The report has been simplified to focus on the information most relevant to consumers, such as the maximum possible exposure as a percentage of allowable safety limits.
This new format was created following consultation with the regulator – the Australian Communications and Media Authority (ACMA); industry body Australian Mobile Telecommunications Association (AMTA), and the peak consumer group – the Australian Communications Consumer Action Network (ACCAN).
If you have any questions about your radio wave exposure, we encourage you to contact our Talk to a Scientist service.