Data submitted for the IGIP survey in 2019 are summarised below.
Submissions were received from 21 facilities incorporating 42 interventional rooms. A total of 47 surveys were submitted, with data from procedures for 1278 patients.
Facility reference levels (FRLs) were computed for all surveys that included at least 10 patients. The data for coronary angiography are presented below as this was the only protocol with sufficient data.
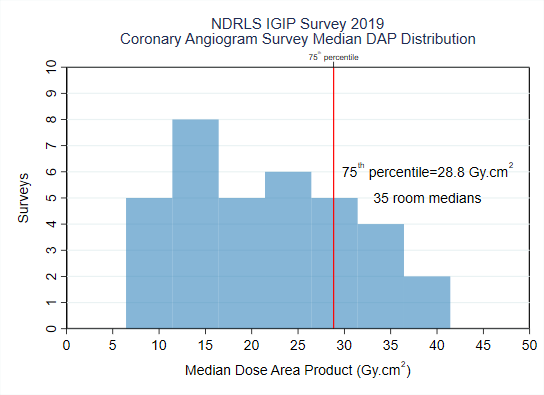
Figure 1a: Coronary angiogram survey median DAP distribution
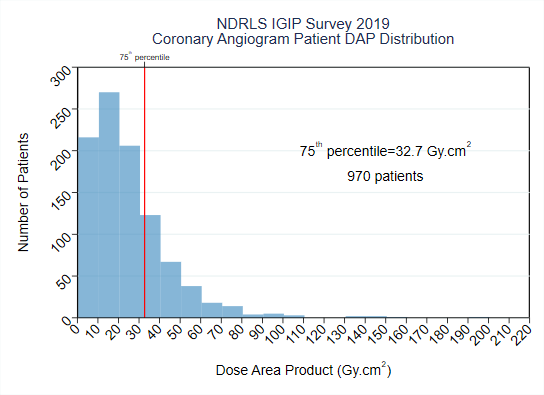
Figure 1b: Coronary angiogram patient DAP distribution
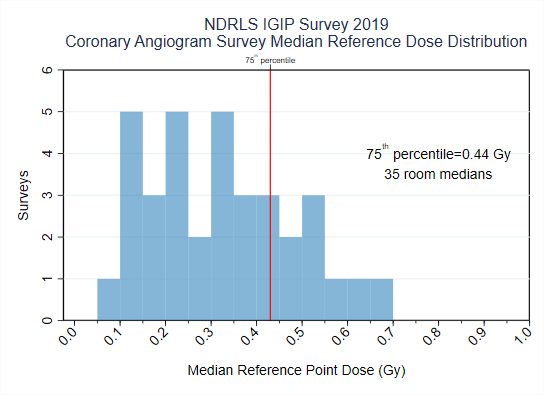
Figure 2a: Coronary angiogram survey median reference dose distribution
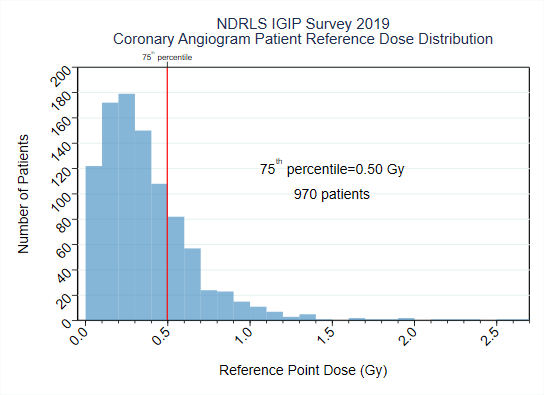
Figure 2b: Coronary angiogram patient reference dose distribution
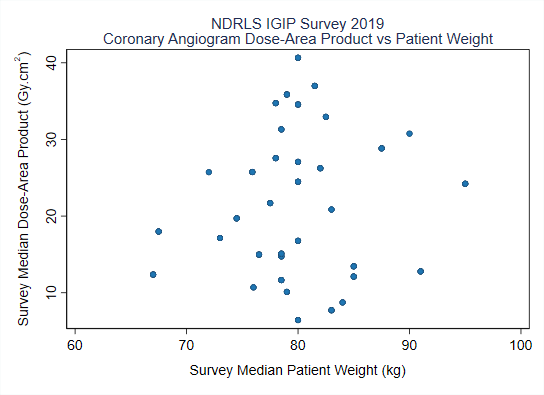
Figure 3: Coronary angiogram dose-area product vs patient weight
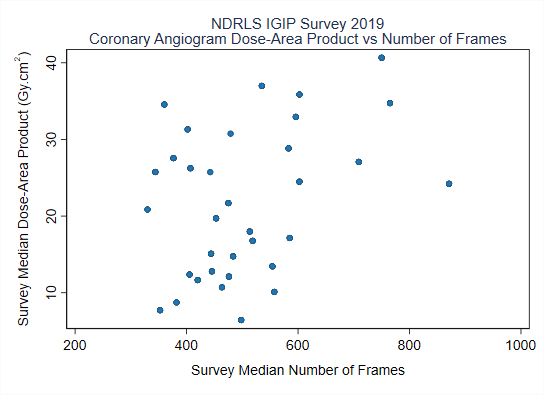
Figure 4: Coronary angiogram dose-area product vs number of frames