Multi detector computed tomography statistics
If you are conducting a publicly funded research project and would like to gain access to an anonymised version of the NDRLS MDCT dataset, please contact the NDRLS team.
Current diagnostic reference levels
Data used to calculate the current Australian adult MDCT DRLs
The most recent DRLs were derived from a subset of the data submitted to the NDRLS MDCT survey during 2017. The criteria for inclusion were that:
- The median age of the surveyed patients was over 20 years of age, and
- The surveys were either from single series studies or from dual-series chest abdomen pelvis (CAP) studies
The facility reference levels (FRLs) - defined as the median dose length product (DLP) and the median volumetric computed tomography dose index (CTDIvol) - were calculated for each submitted survey. The DRLs for head, chest, abdomen pelvis and lumbar spine scans are simply the 75th percentile of the relevant FRL distributions rounded up to the nearest two significant figures.
For CAP surveys, a correction was applied where facilities that had conducted a dual-series scan (e.g. a separate CT of the chest and the abdomen pelvis) were thought to have erroneously provided the sum of the CTDIvol from each series rather than providing the average. These cases were identified by looking for scans with improbably short implied scan length (i.e. DLP divided by CTDIvol). The length of 55 cm was chosen arbitrarily after inspecting the scan lengths of chest, abdomen pelvis and CAP scans (see Figure 1).
Figure 1: Implied scan length of different protocols submitted to the NDRLS during 2017. The left-most CAP peak corresponds to an improbably short scan length, and appears to consist mainly of dual-series scans
The CTDIvol of patients in surveys with a median implied scan length of 55 cm or under were divided by 2 and the implied scan lengths recalculated and compared with the remaining CAP scans. The distributions of implied scan length for dual-series scans is shown in Figure 2, below.
Figure 2: Histograms of the implied scan lengths for individual patients, categorised by whether or not the median implied scan length of the submitted survey was at or under 55 cm. The lower figure is the implied scan length distribution after dividing the relevant CTDIvol data by 2
The soft-tissue neck and cervical-spine DRLs were derived from the neck surveys submitted to the NDRLS MDCT survey during 2017. Although users weren’t required to specify what sort of neck scans were being reported, a number of users did include it in the comments field of the submitted surveys. Using this information, combined with whether or not contrast was used (if it was, the survey was assumed to be of soft-tissue) and finally the implied scan length, it was possible to separate the scan types (see Figure 3). It is highly likely that some of the surveys will have been misclassified, but ARPANSA believes that the resultant DRLs are representative.
Figure 3: The implied scan length of neck surveys submitted to the NDRLS during 2017 classified by their presumed sub-type
Data used to calculate the current Australian paediatric MDCT DRLs
Unlike the adult MDCT DRLs, the paediatric DRLs have not yet been updated.
Insufficient surveys were submitted in 2011 for paediatric DRLs to be calculated using the same process used for adult patients. Instead, ARPANSA calculated the current Australian paediatric MDCT DRLs using data collected by an independent Royal Australian and New Zealand College of Radiologists (RANZCR) survey. The RANZCR Quality Use of Diagnostic Imaging (QUDI) survey collected dosimetry information from twelve facilities.
Adult MDCT DRLs have previously been determined by calculating the 75th percentile of the spread of FRLs. The QUDI dataset did not allow this approach; instead, the paediatric MDCT DRLs were calculated by determining the 75th percentile of the spread of individual doses submitted.
The tables below summarise the QUDI data. See Australas Phys Eng Sci Med (2016) 39:615–626 (DOI 10.1007/s13246-016-0431-4) for more details.
Table 1: Data used in the calculation of Australian paediatric MDCT DRLs
Baby (0-5 years) | Child (5-15 years) | ||||||
Head | Chest | Abdomen pelvis | Head | Chest | Abdomen pelvis | ||
No. of scans | 374 | 107 | 40 | 497 | 119 | 128 | |
Age | Mean | 2.0 | 2.1 | 3.0 | 9.7 | 9.4 | 10.5 |
Standard deviation | 1.5 | 1.6 | 1.4 | 3.0 | 3.0 | 3.0 | |
25th percentile | 0.7 | 0.6 | 2.2 | 6.8 | 6.4 | 8.0 | |
75th percentile | 3.3 | 3.5 | 4.3 | 12.4 | 11.7 | 13.5 | |
CTDIvol | Mean | 21.2 | 2.0 | 5.4 | 29.5 | 4.3 | 7.7 |
Standard deviation | 8.2 | 2.5 | 4.7 | 10.0 | 5.6 | 4.7 | |
25th percentile | 15.8 | 0.9 | 1.9 | 24.3 | 1.2 | 5.5 | |
75th percentile | 25.5 | 1.8 | 6.5 | 32.9 | 5.2 | 8.9 | |
DLP | Mean | 344.1 | 46.8 | 129.1 | 492.9 | 88.5 | 303.9 |
Standard deviation | 167.7 | 29.3 | 82.5 | 205.3 | 80.1 | 166.9 | |
25th percentile | 211.3 | 20.9 | 57.7 | 388.6 | 45.0 | 203.1 | |
75th percentile | 469.0 | 60.2 | 165.6 | 604.1 | 109.1 | 388.1 |
Superseded DRLs
Data used to calculate the 2012 Australian adult MDCT DRLs
ARPANSA calculated the original Australian adult DRLs for MDCT using data submitted to the NDRLS MDCT survey in 2011. The DRLs are shown in Table 2 below.
Table 2: 2012 Australian adult MDCT DRLs (superseded)
Adult protocol | DLP (mGy.cm) | CTDIvol (mGy) |
---|---|---|
Head | 1000 | 60 |
Neck | 600 | 30 |
Chest | 450 | 15 |
Abdomen pelvis | 700 | 15 |
Chest abdomen pelvis | 1200 | 30 |
Lumbar spine | 900 | 40 |
Eighty radiology facilities registered for the service in 2011, collectively submitting 255 surveys. The facility reference levels (FRLs), defined as the median dose length product (DLP) and the median volumetric computed tomography dose index (CTDIvol), were calculated for each submitted survey. The DRLs were then based on the 75th percentile of the spread of FRLs. Table 3 lists the number of FRLs and the 75th percentiles of FRLs for each protocol in terms of both DLP and CTDIvol.
The 95% confidence intervals (CIs) listed have been calculated in terms of percentile using the following equation1:
where N is the number of FRLs in the distribution. Figures 1 and 2 show the Australian adult MDCT DRLs calculated for each protocol with 95% confidence intervals.
Table 3: Data used in the calculation of Australian adult MDCT DRLs
Adult protocol | No. FRLs1 | 75th percentile DLP (mGy.cm) | 95% CI2 DLP | 75th percentile CTDIvol (mGy) | 95% CI2 CTDIvol |
---|---|---|---|---|---|
Head | 56 | 991.6 | 953.5-1055.4 | 60.8 | 55.9-66.3 |
Neck | 30 | 597.3 | 527.3-750.4 | 31.6 | 23.0-38.5 |
Chest | 44 | 458.3 | 407.1-572.3 | 14.3 | 12.9-20.5 |
Abdomen pelvis | 51 | 696.8 | 628.9-847.4 | 17.0 | 13.5-18.4 |
Chest abdomen pelvis | 40 | 1147.8 | 1007.0-1279.2 | 31.7 | 24.3-33.6 |
Lumbar spine | 34 | 896.3 | 757.0-1086.7 | 43.3 | 31.4-50.4 |
Figure 4: The Australian adult MDCT DRL for dose-length product (DLP, mGy.cm) with 95% confidence intervals
Figure 5: The Australian adult MDCT DRL for the volume computed tomography dose index (CTDIvol, mGy) with 95% confidence intervals
NDRLS MDCT survey participation
Facility registrations
Figure 6 and Figure 7 show the date that facilities currently registered with the NDRLS first registered. The colours in Figure 6 and Figure 7 categorise the facilities by state/territory and facility type respectively.
Figure 6: Area plot showing the number of facilities registered with the NDRLS MDCT survey, categorised by state
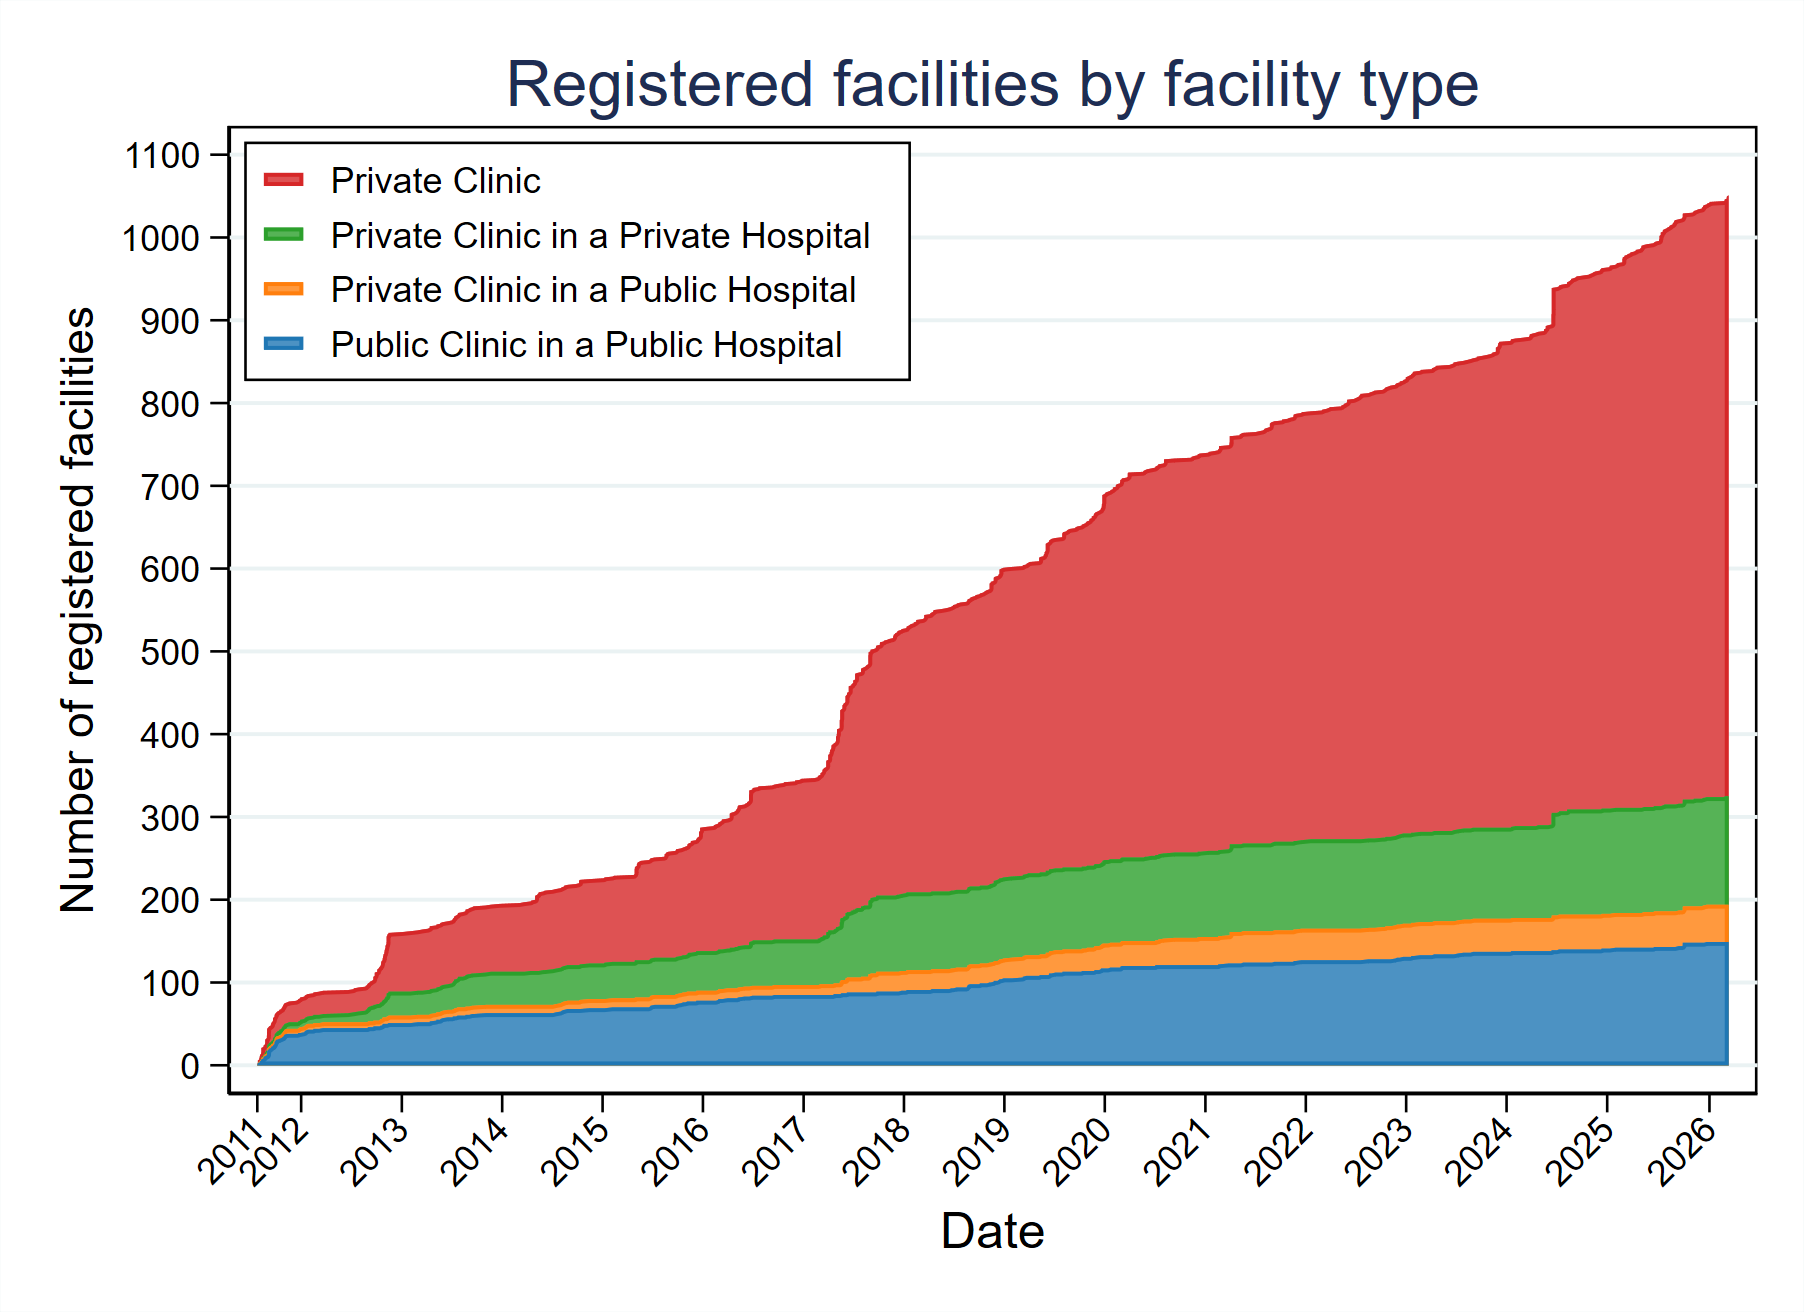
Figure 7: Area plot showing the number of facilities registered with the NDRLS MDCT survey, categorised by the type of facility
Number of surveys submitted
Table 4 shows the number of surveys submitted to the NDRLS between April 2011 (the start of the service) and the end of 2017, categorised by protocol and age group.
Table 4: Number of survey submitted to the NDRLS MDCT survey, categorised by age group, protocol and year
Age group | Protocol | 2011 | 2012 | 2013 | 2014 | 2015 | 2016 | 2017 | Total |
---|---|---|---|---|---|---|---|---|---|
Adult (15+ years) surveys submitted | Abdomen pelvis | 51 | 100 | 150 | 128 | 194 | 274 | 442 | 1339 |
Chest | 44 | 78 | 112 | 113 | 177 | 258 | 422 | 1204 | |
Chest abdomen pelvis | 40 | 68 | 100 | 93 | 135 | 200 | 368 | 1004 | |
Head | 56 | 113 | 166 | 147 | 202 | 284 | 465 | 1433 | |
Lumbar spine | 34 | 75 | 116 | 105 | 156 | 237 | 419 | 1142 | |
Neck | 30 | 57 | 80 | 76 | 141 | 192 | 358 | 934 | |
Total | 255 | 491 | 724 | 662 | 1005 | 1445 | 2474 | 7056 | |
Child (5-14 years) surveys submitted | Abdomen pelvis | 0 | 3 | 6 | 4 | 6 | 5 | 6 | 30 |
Chest | 0 | 7 | 8 | 7 | 8 | 9 | 13 | 52 | |
Head | 0 | 28 | 26 | 19 | 22 | 22 | 16 | 133 | |
Total | 0 | 38 | 40 | 30 | 36 | 36 | 35 | 215 | |
Baby (0-4 years) surveys submitted | Abdomen pelvis | 0 | 0 | 2 | 2 | 1 | 2 | 2 | 9 |
Chest | 0 | 3 | 5 | 4 | 3 | 4 | 7 | 26 | |
Head | 0 | 20 | 23 | 18 | 17 | 20 | 13 | 111 | |
Total | 0 | 23 | 30 | 24 | 21 | 26 | 22 | 146 |
FRL distributions
The curves below show the cumulative distributions for the DLP and CTDIvol from adult DRL surveys submitted between April 2013 (when ARPANSA started to record whether iterative reconstruction was used) and the end of 2017. The y-axis displays the percentage of facilities that achieved an FRL below the dose specified on the x-axis.
The blue curve represents all of the submitted data, the orange curve represents the surveys where iterative reconstruction (IR) was used and the green curve represents the surveys where filtered back projection (FBP) was used. The data portrayed is more recent than the data used to specify the current DRLs and, consequently, the DRLs do not match the 75th percentile of the plotted distributions – in general, the 75th percentile is considerably lower than the DRL.
View similar plots for the other protocols.
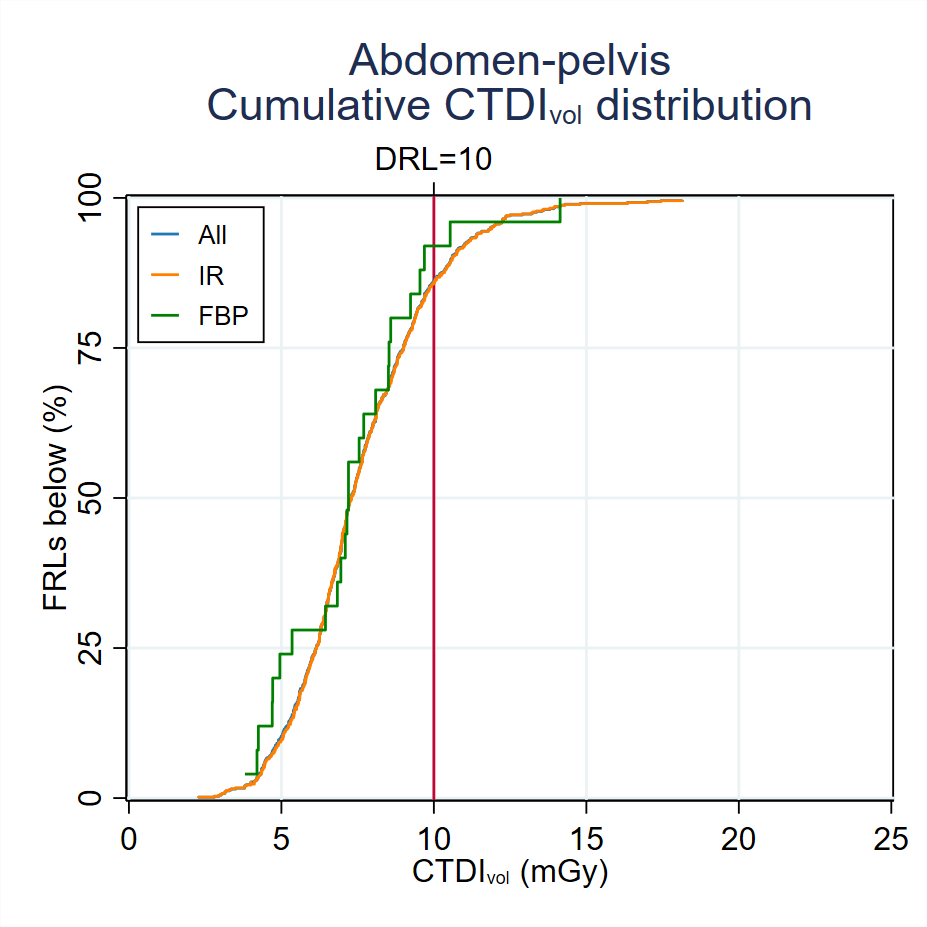
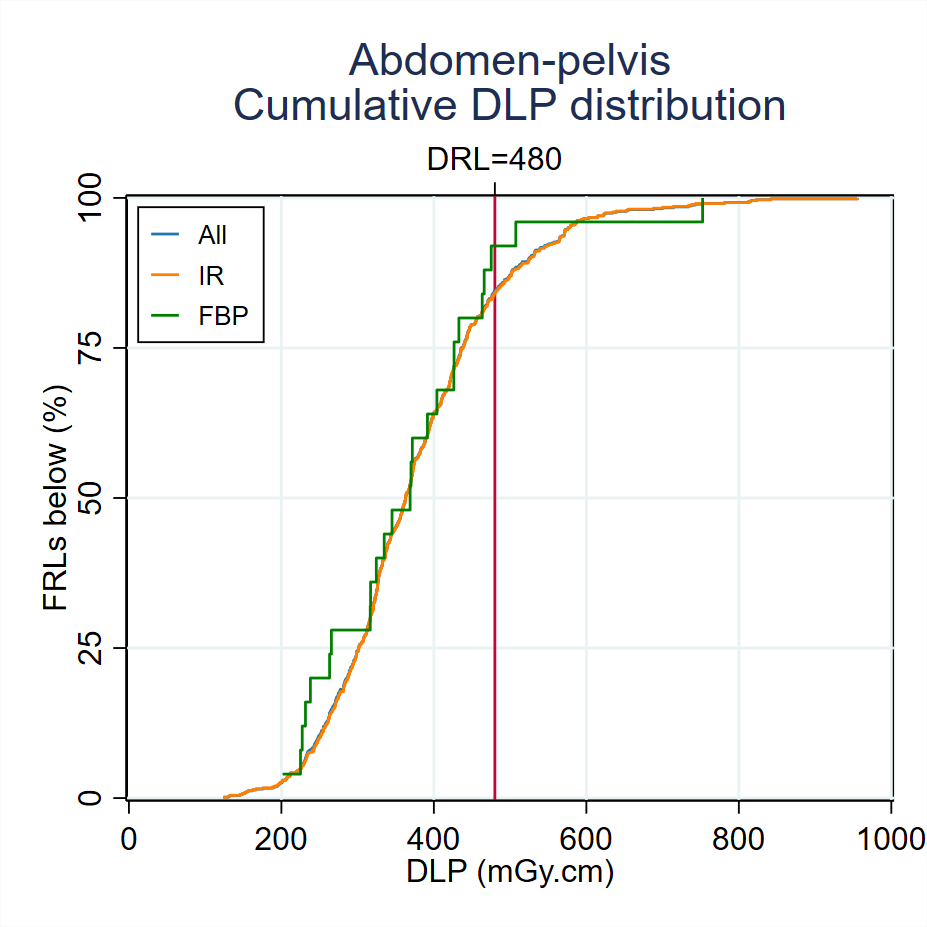
Figure 8: Cumulative dose distributions for abdomen pelvis scans conducted on adult patients. The y-axis provides the percentage of facilities that achieved an FRL below the dose specified on the x-axis. The blue, orange and green curves represent all data, data from scans that used iterative reconstruction (IR) and scans that used filtered back projection (FBP) respectively
FRL distribution variation over time
Figure 9 shows the change in the median of the FRL distribution since the beginning of 2012 for adult abdomen pelvis scans. The graph has been generated by examining the surveys submitted during a moving 12-month period, where the start and end points of the window have been shifted by daily intervals. The x-axis is the end date of the 12-month interval, the blue line is the median of the corresponding FRL distribution, the red line denotes the current DRL and the light blue region indicates the 25th – 75th percentile range.
View similar graphs for the other adult FRL distributions.
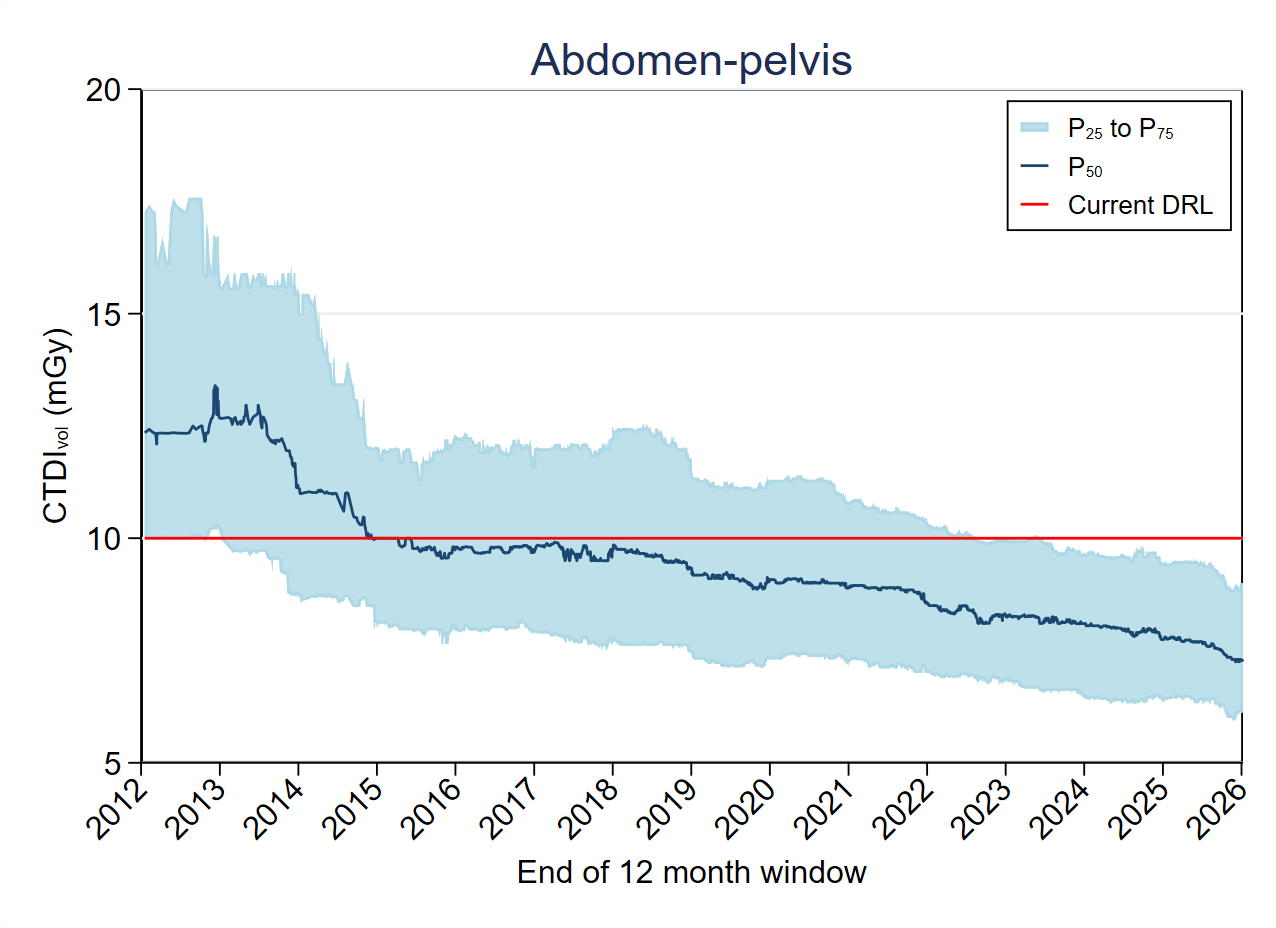
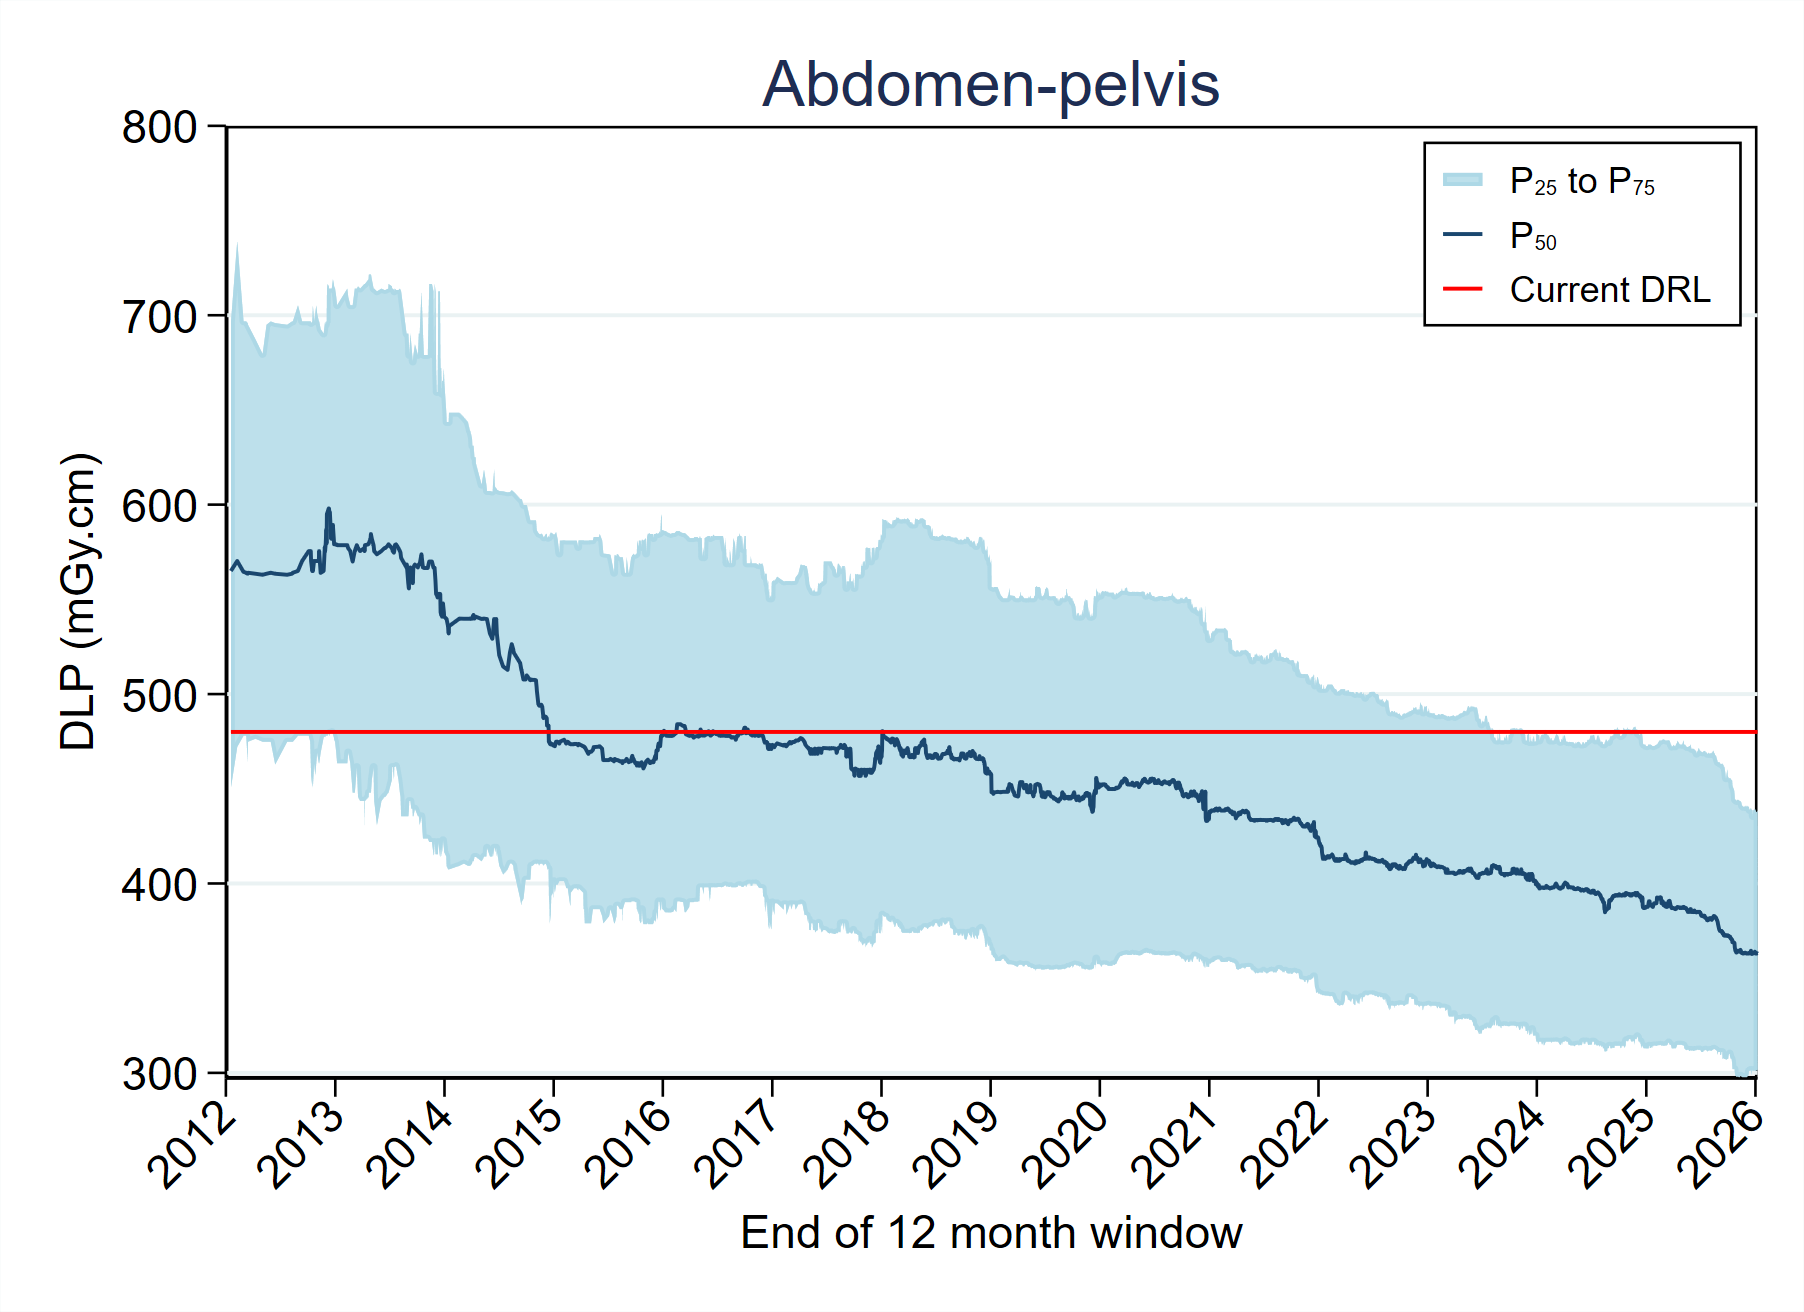
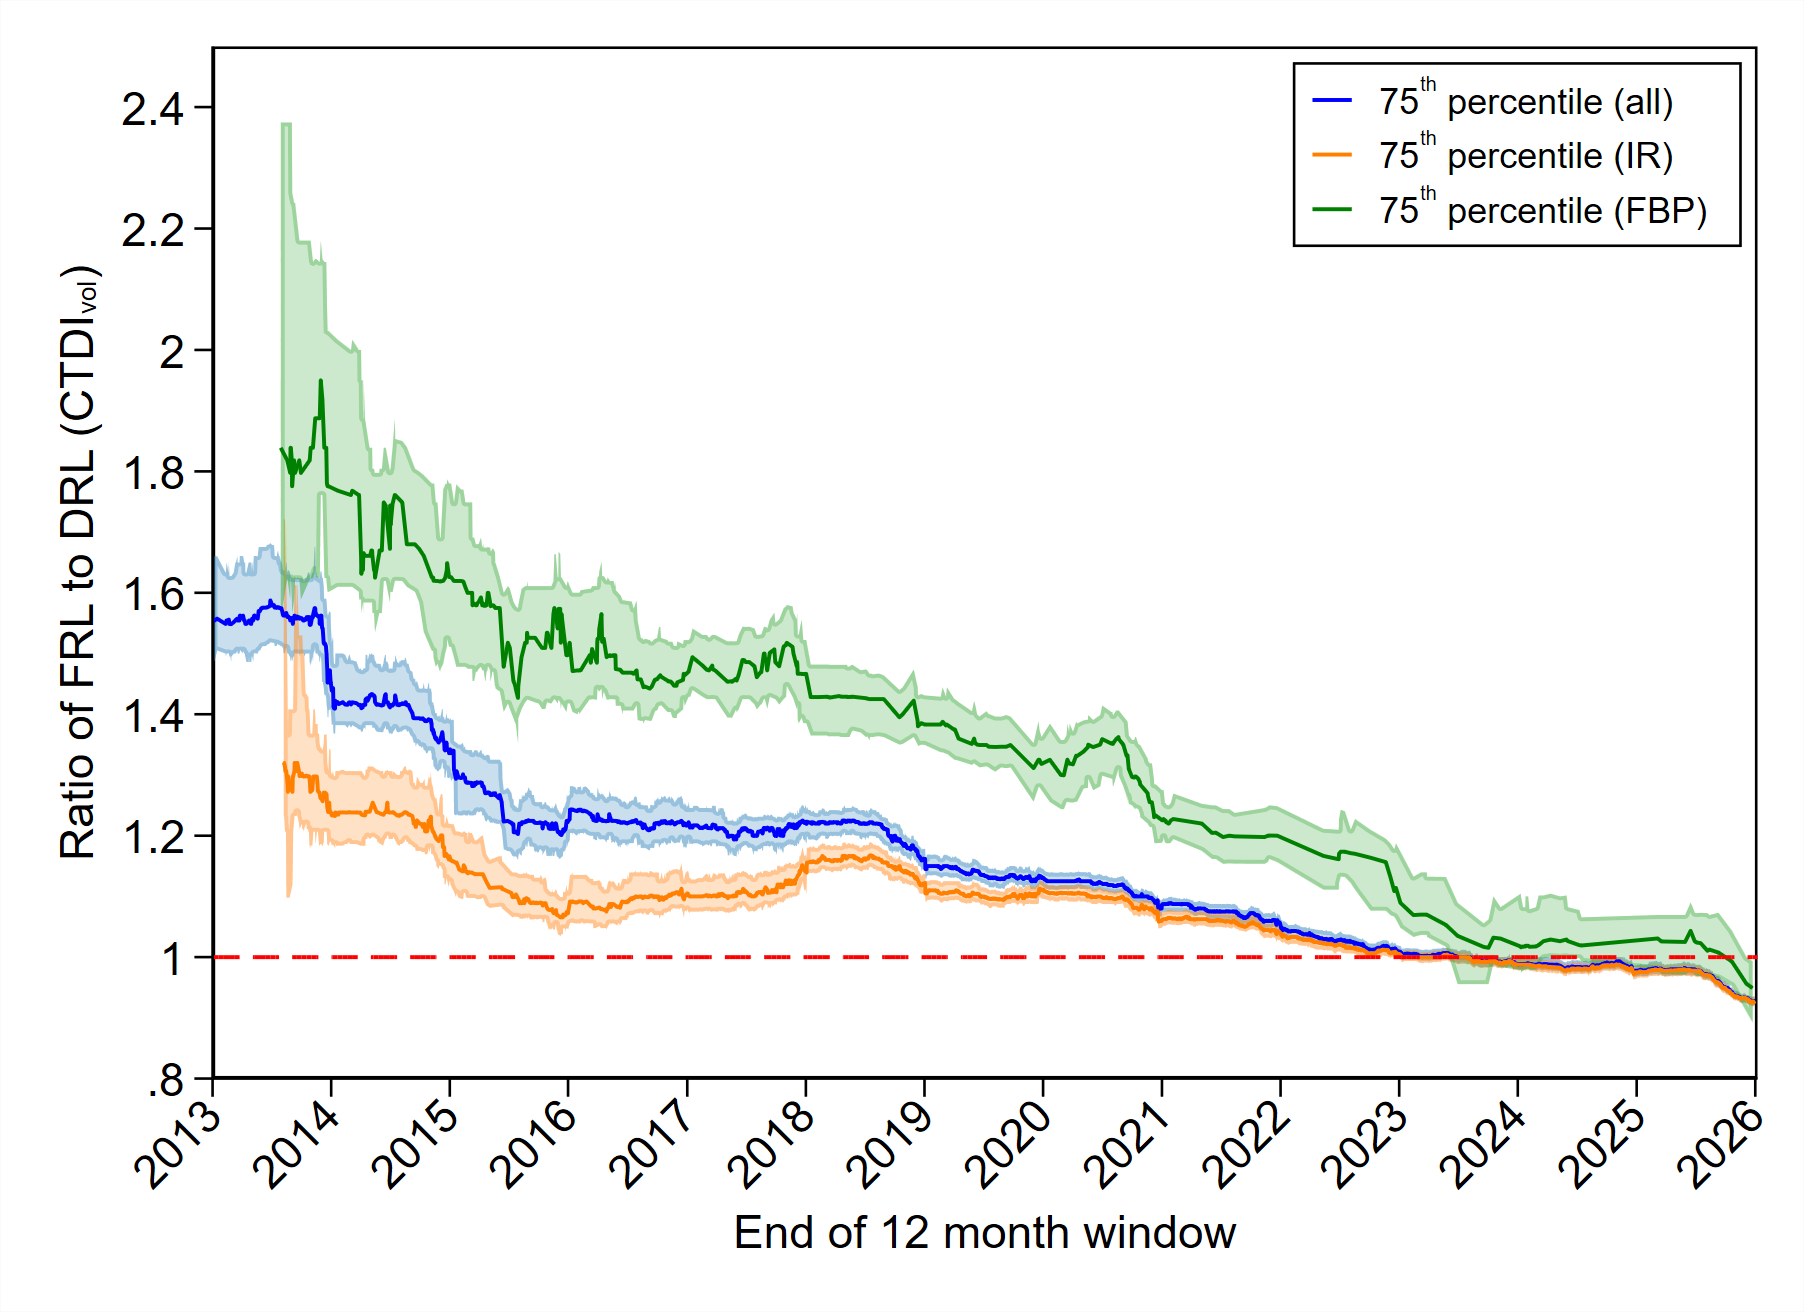
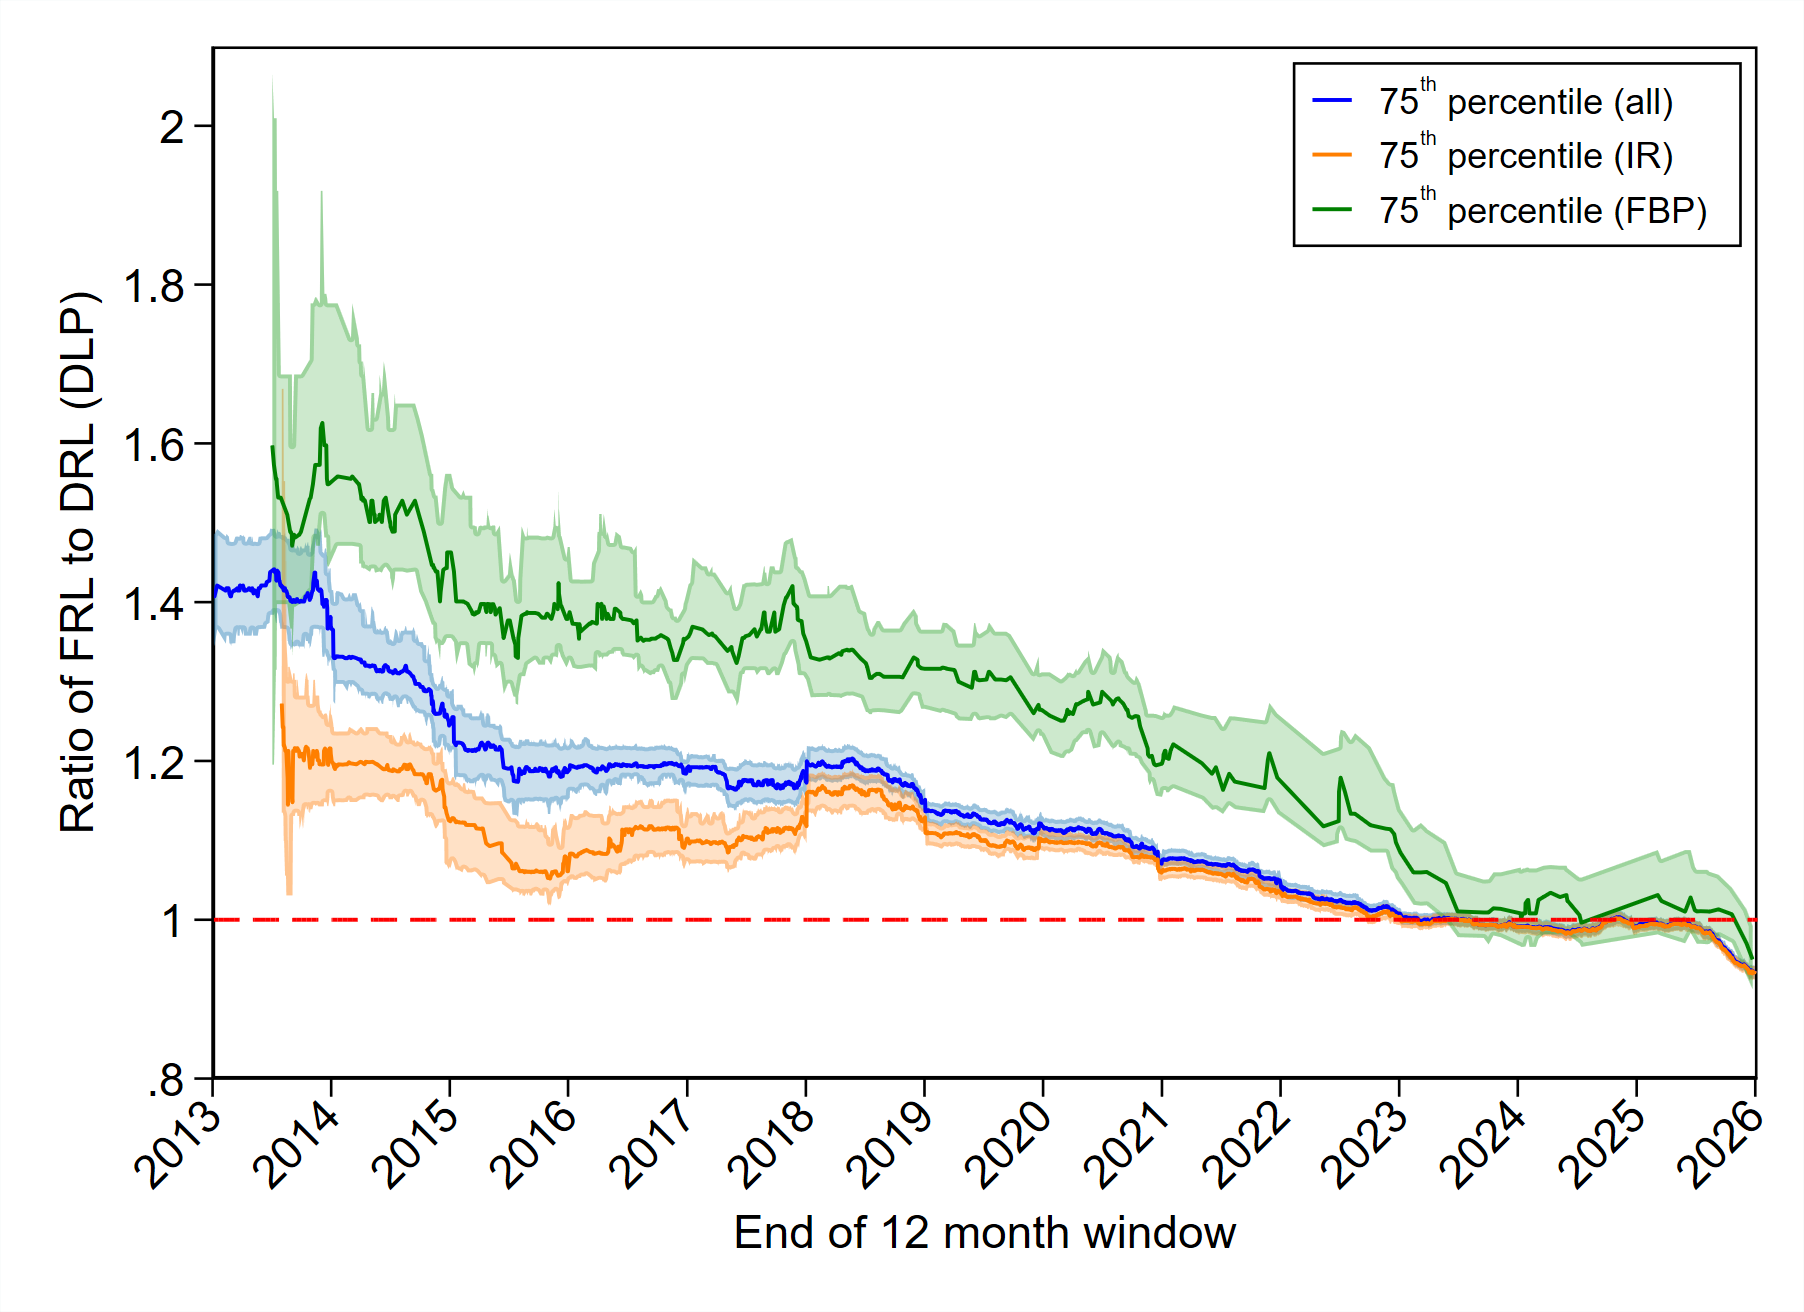
Figure 9: Change in the 75th percentile (P75) of the DLP and the CTDIvol for abdomen pelvis scans. The date along the x-axis denotes the end of the 12-month window of data used to calculate the percentile. The red line represents the current DRL.
Impact of iterative reconstruction
The reductions in the 75th percentile of FRL distribution can be partially attributed to the increased adoption of iterative reconstruction (IR) techniques. Figure 10 shows the number of surveys submitted since April 2013, categorised by the use of IR.
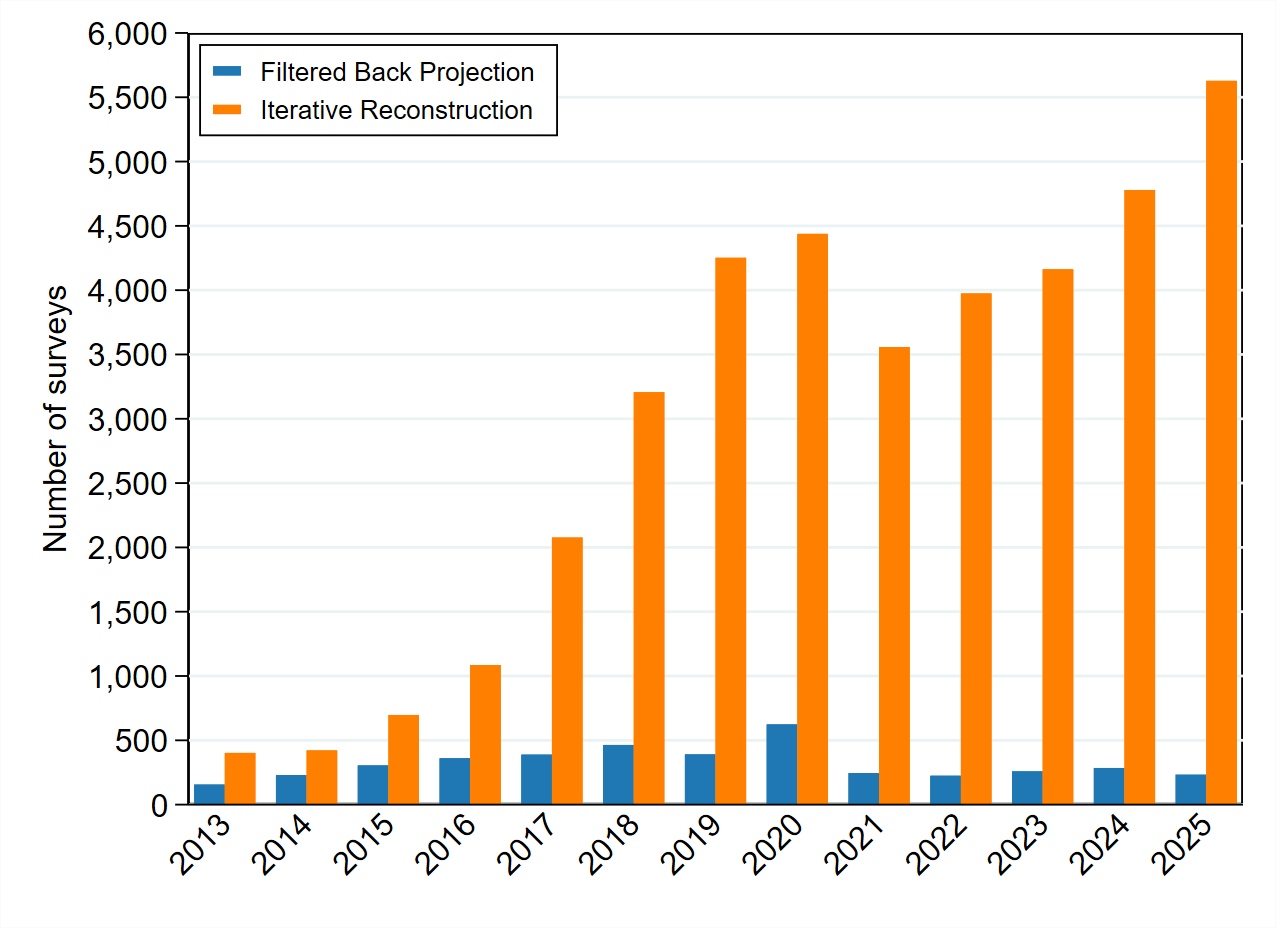
Figure 10: Number of surveys submited since April 2013, categorised by the use of iterative reconstruction (IR) or filtered back projection (FBP)
The change in dose distributions is represented in Figure 11 below. The metric plotted is the 75th percentile of the submitted FRLs, where the FRL has been expressed as a fraction of the relevant DRL. The date along the x-axis represents the end of a 12-month period for which the percentile has been calculated.
Figure 11: Change in the 75th percentile for all protocols. The FRL has been calculated as a fraction of the DRL. The blue, orange and green curves represent all data, data from scans that used Iterative Reconstruction (IR) and scans that used Filtered Back Projection (FBP) respectively. The 95% confidence intervals for each curve are also shown – the 95% CI gives an indication of the number of surveys submitted (a wider CI suggests fewer surveys).
The dose reduction achieved using iterative reconstruction varies with protocol. Table 5 shows the reduction in dose for each protocol when iterative reconstruction is used.
Table 5: Difference between the median of iterative reconstruction survey doses compared to surveys where filtered back projection was used.
Protocol | Reduction in median DLP (%) | Reduction in median CTDIvol (%) |
---|---|---|
Abdomen pelvis | 19.8 | 24.9 |
Chest | 22.3 | 29.5 |
Chest abdomen pelvis | 25.8 | 38.3 |
Head | 14.9 | 19.5 |
Lumbar spine | 23.2 | 25.4 |
Neck | 27.4 | 34.5 |
1 From Conover, W.J. (1980) Practical Nonparametric Statistics John Wiley and Sons, New York