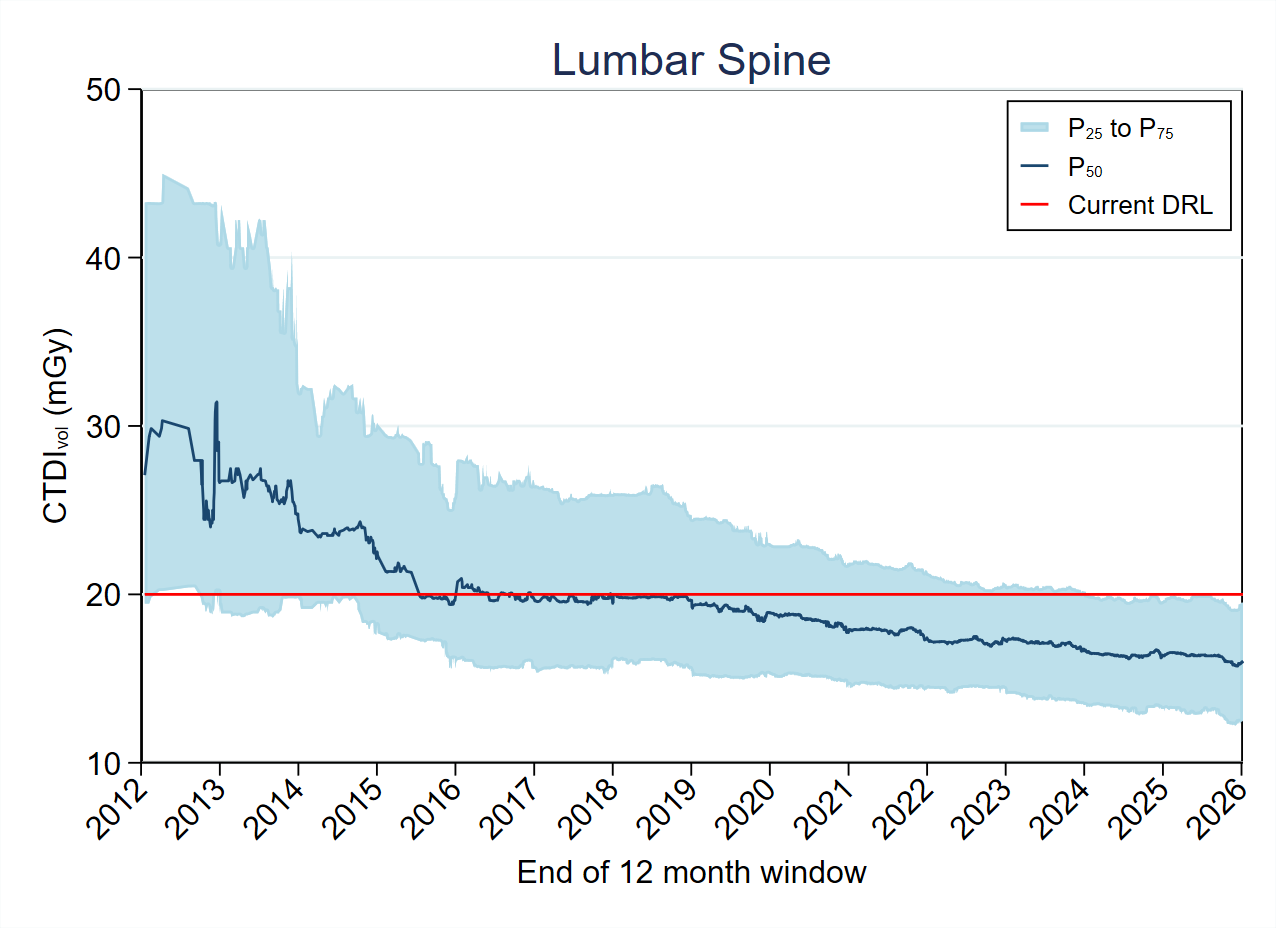
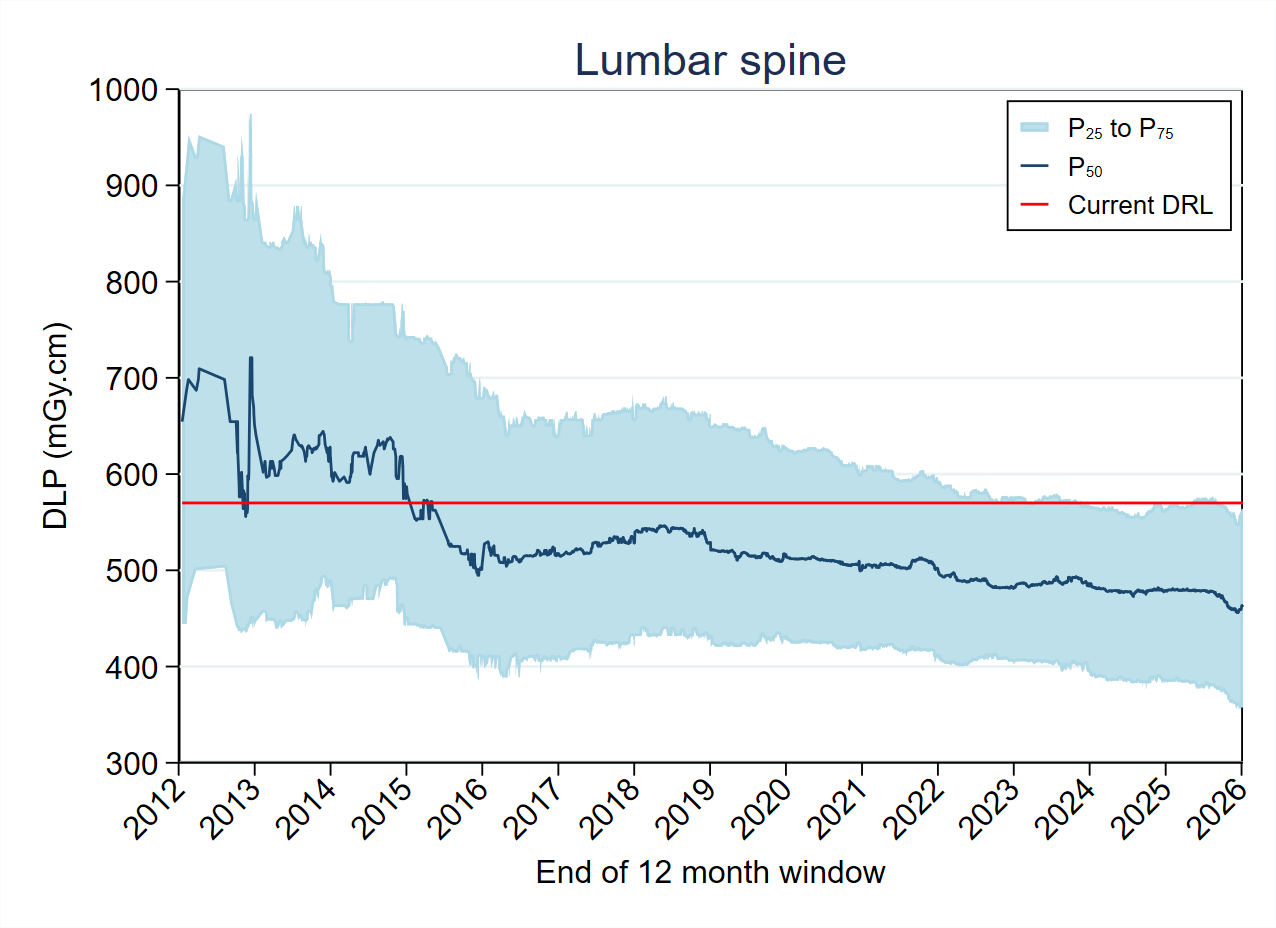
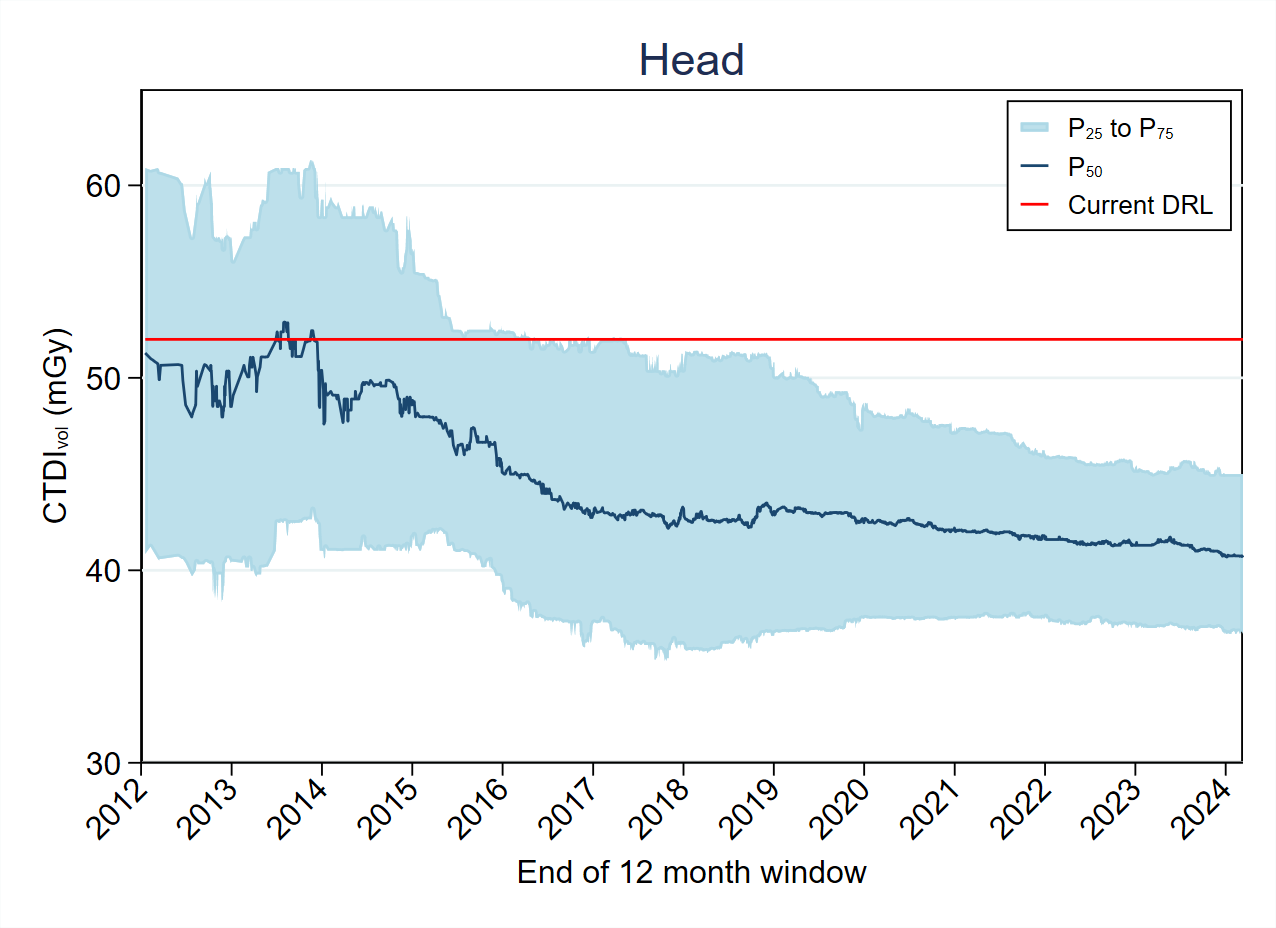
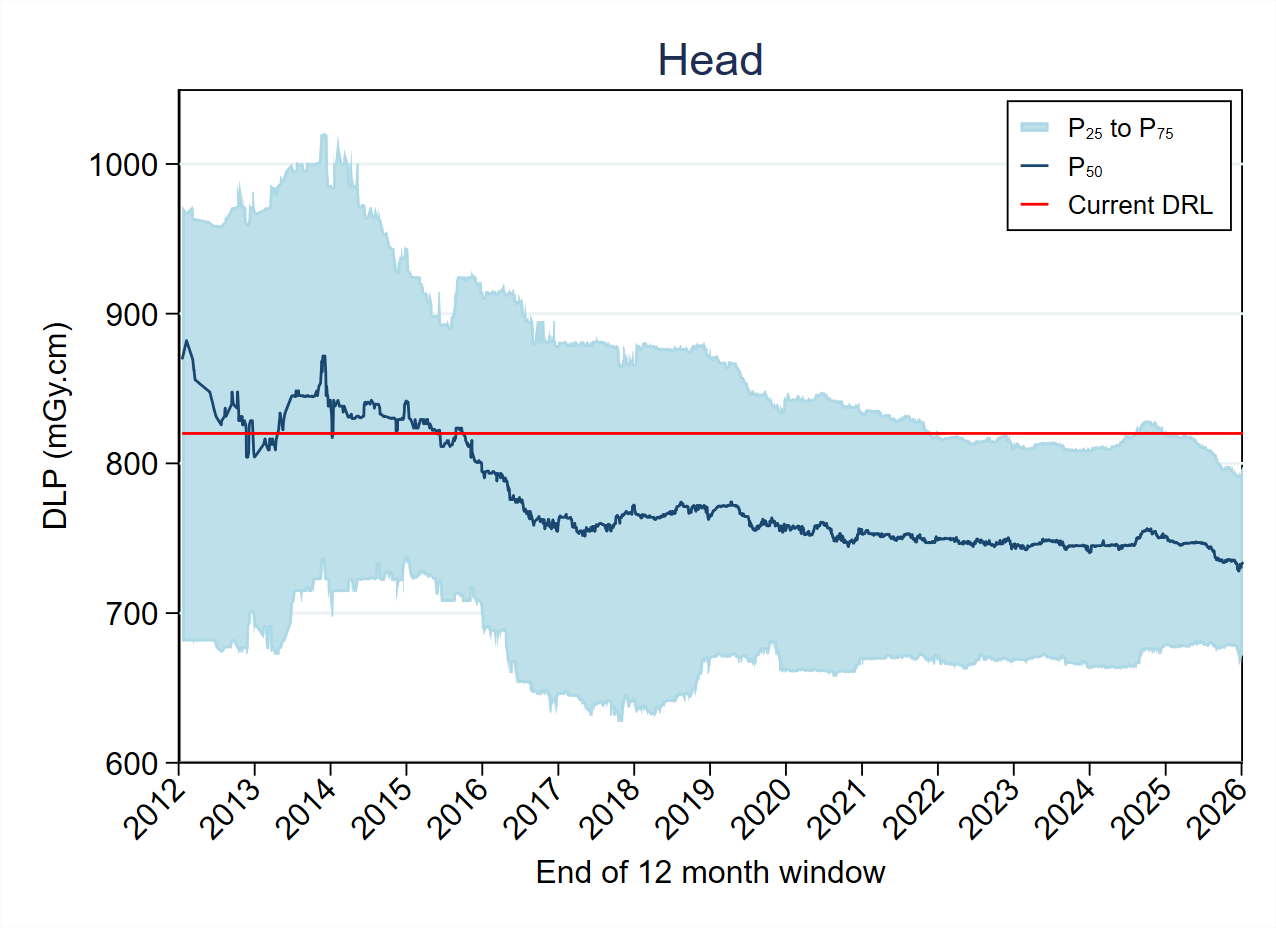
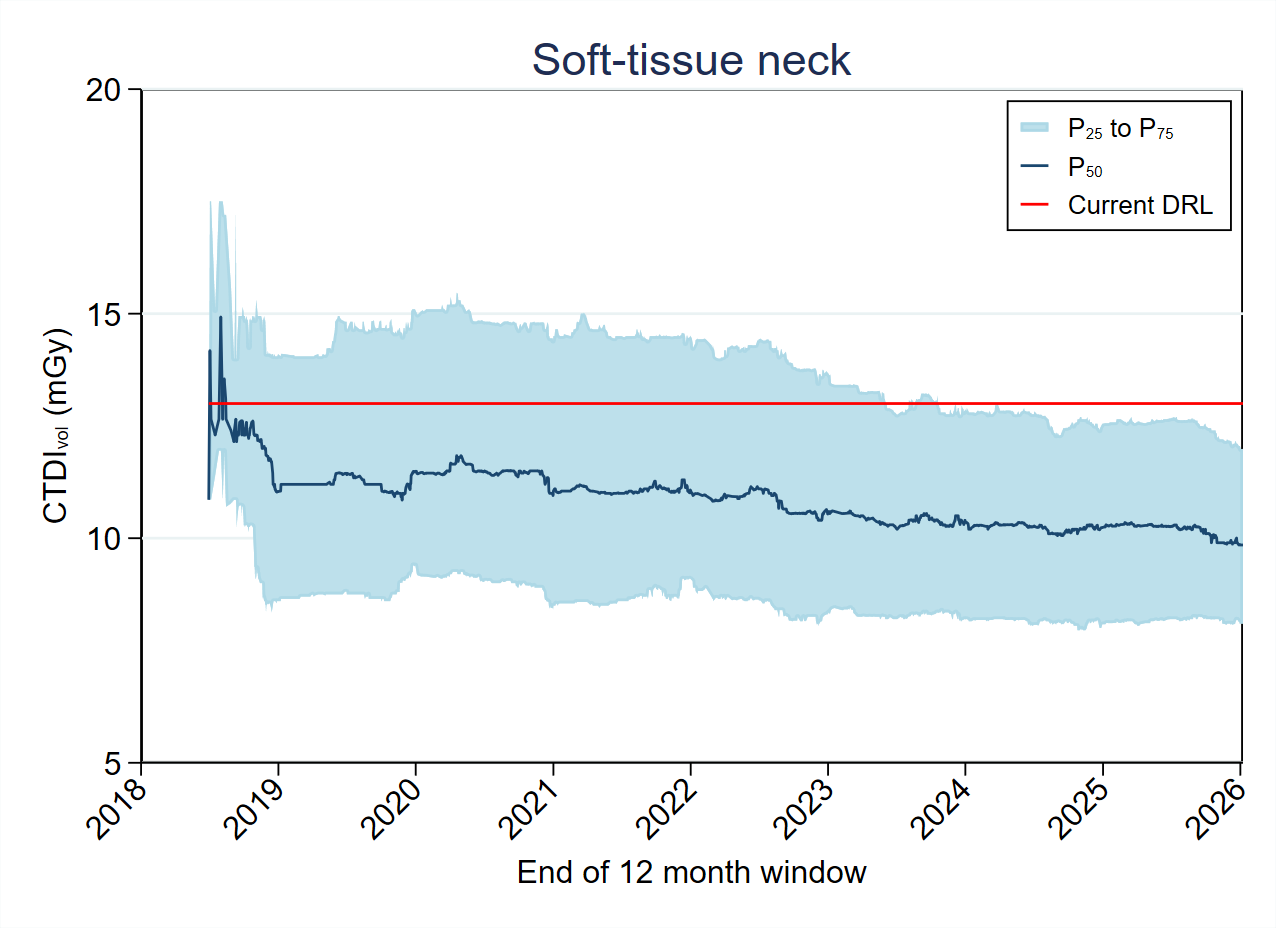
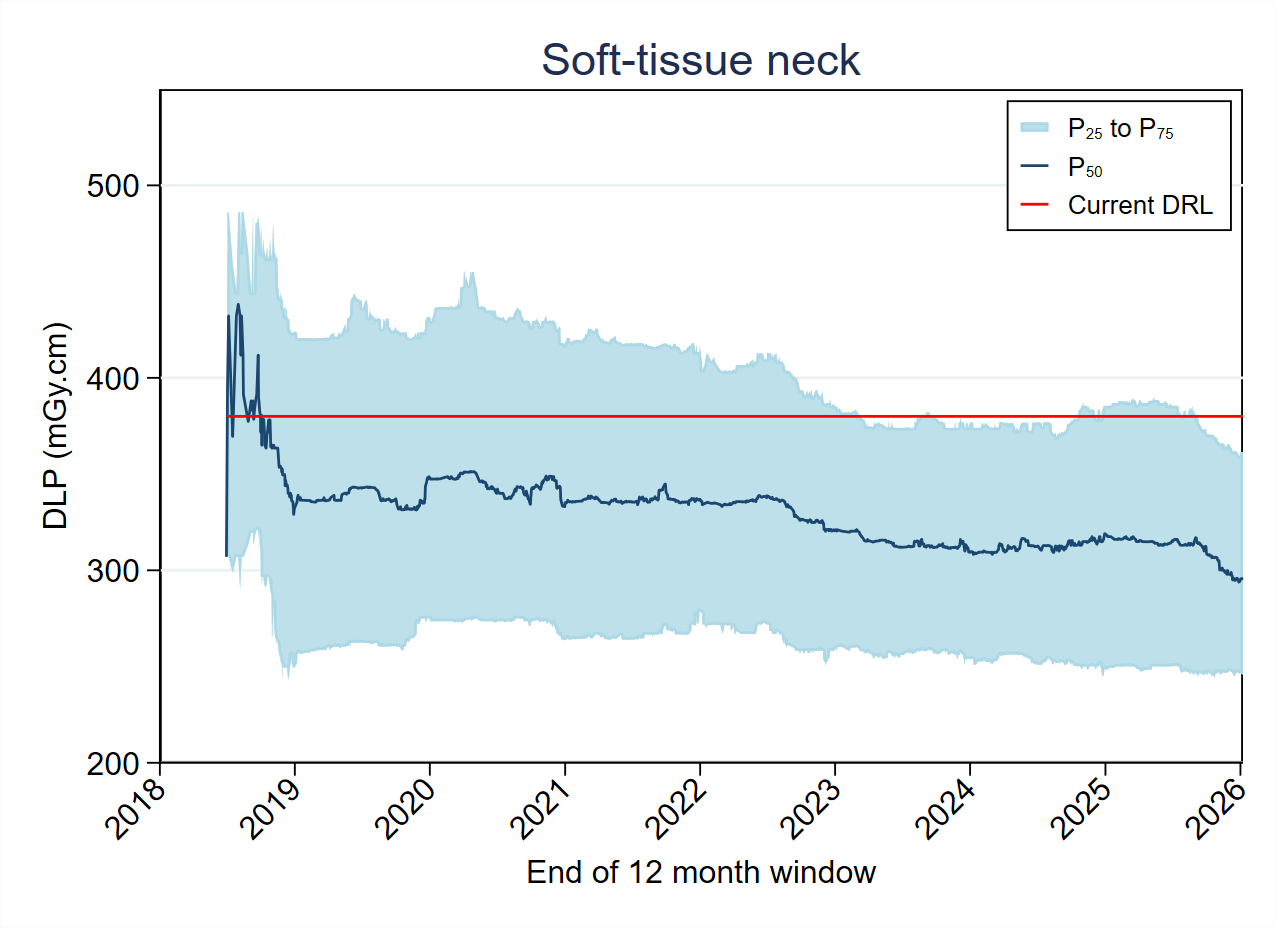
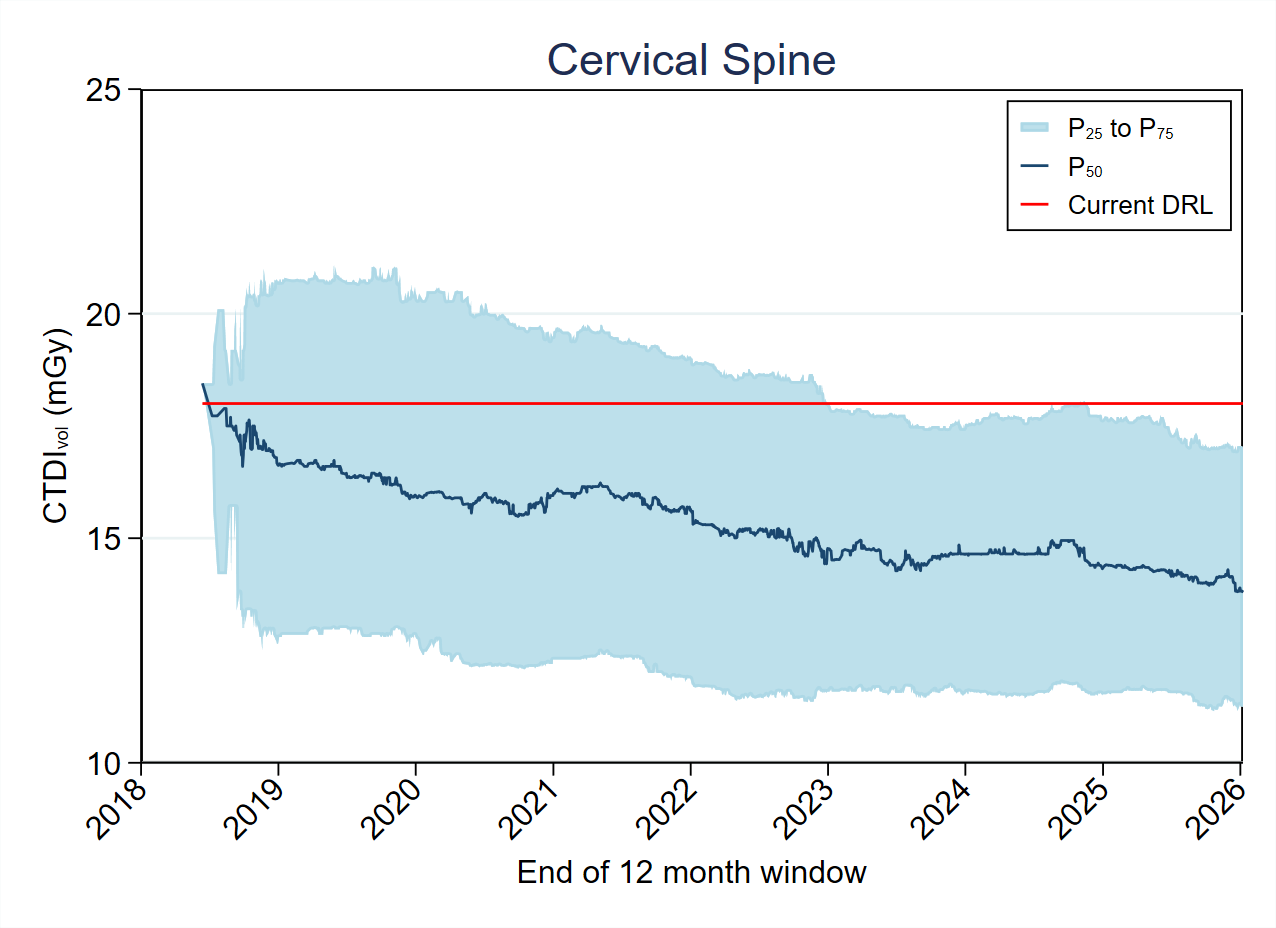
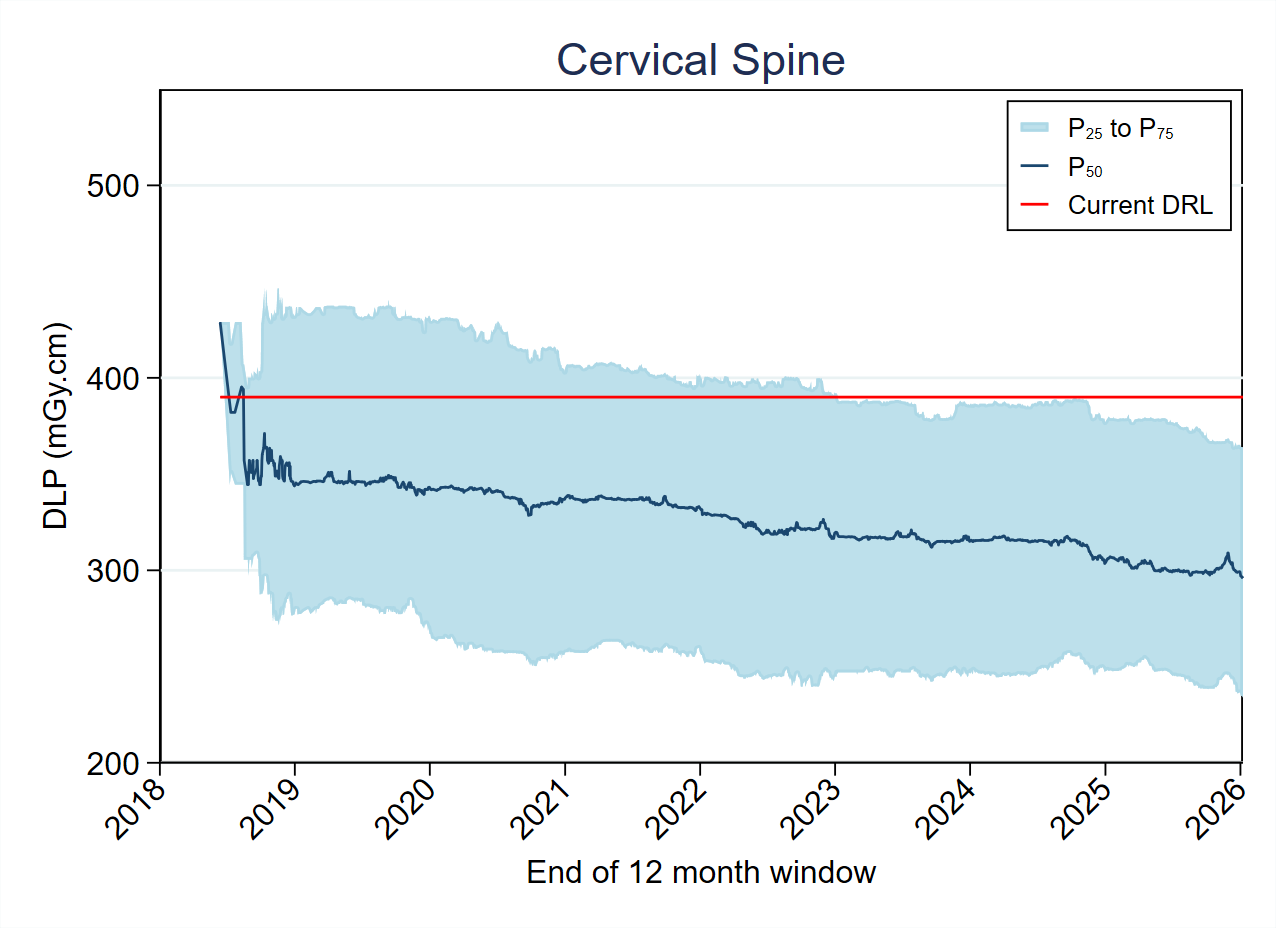
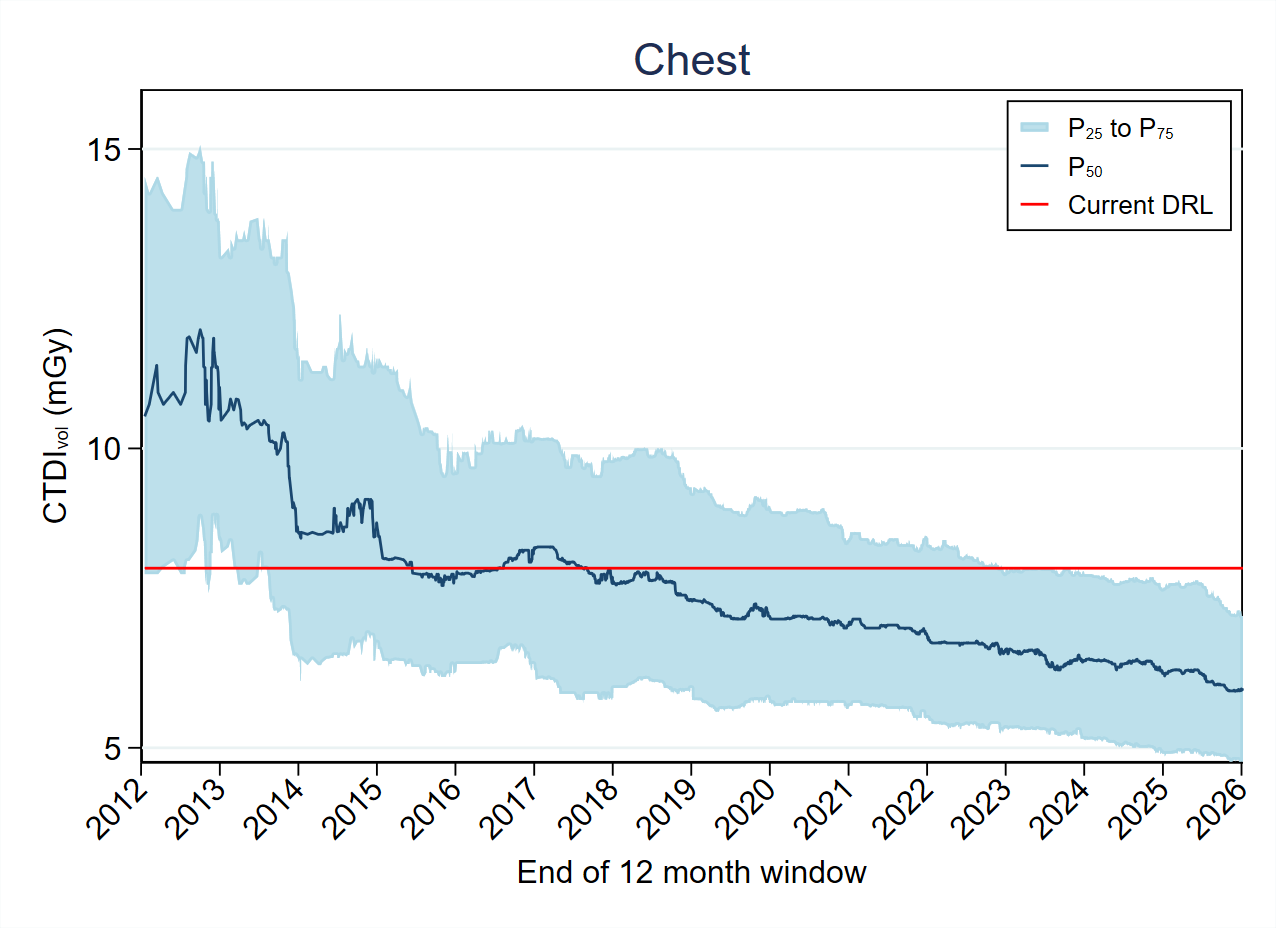
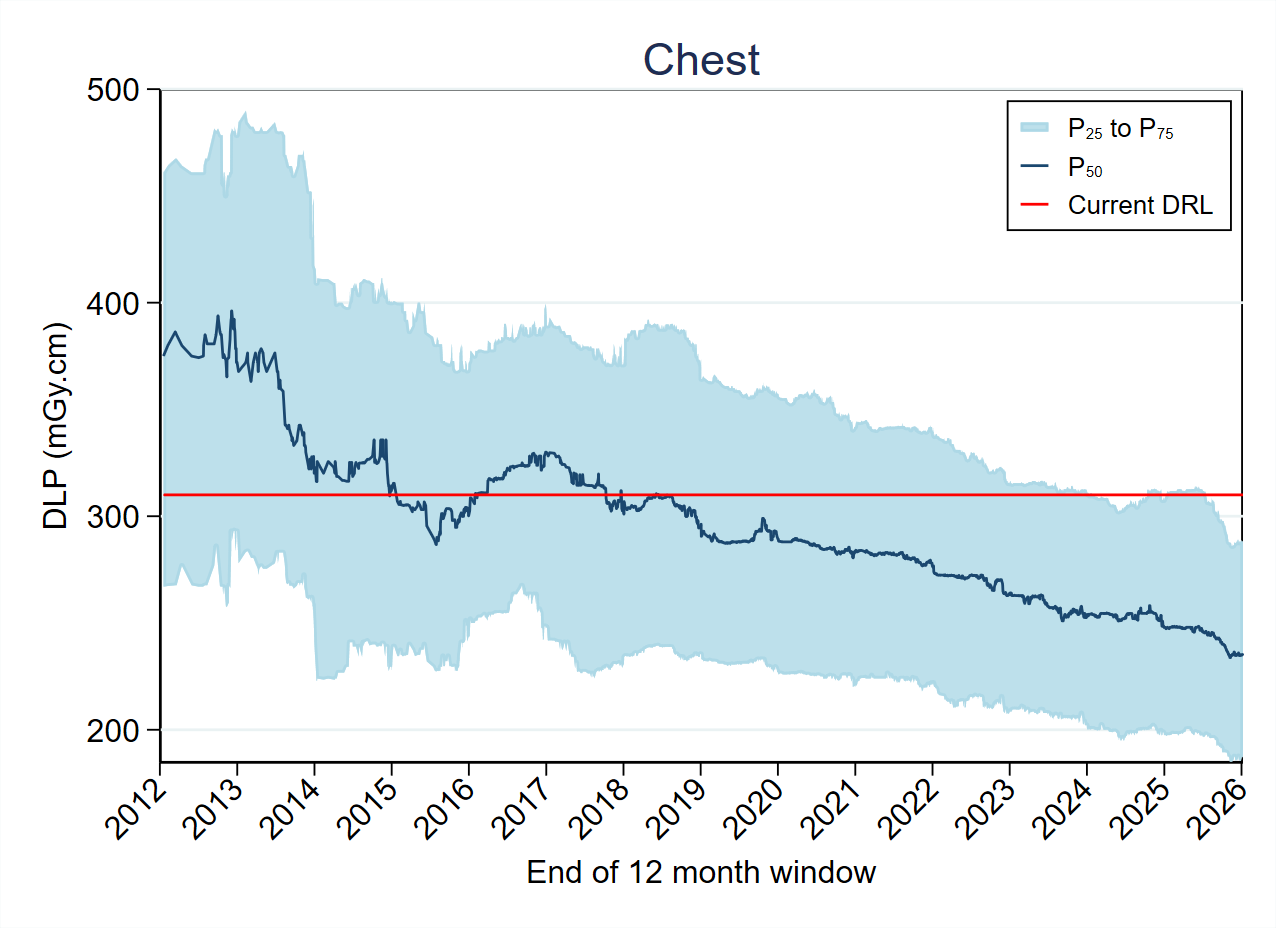
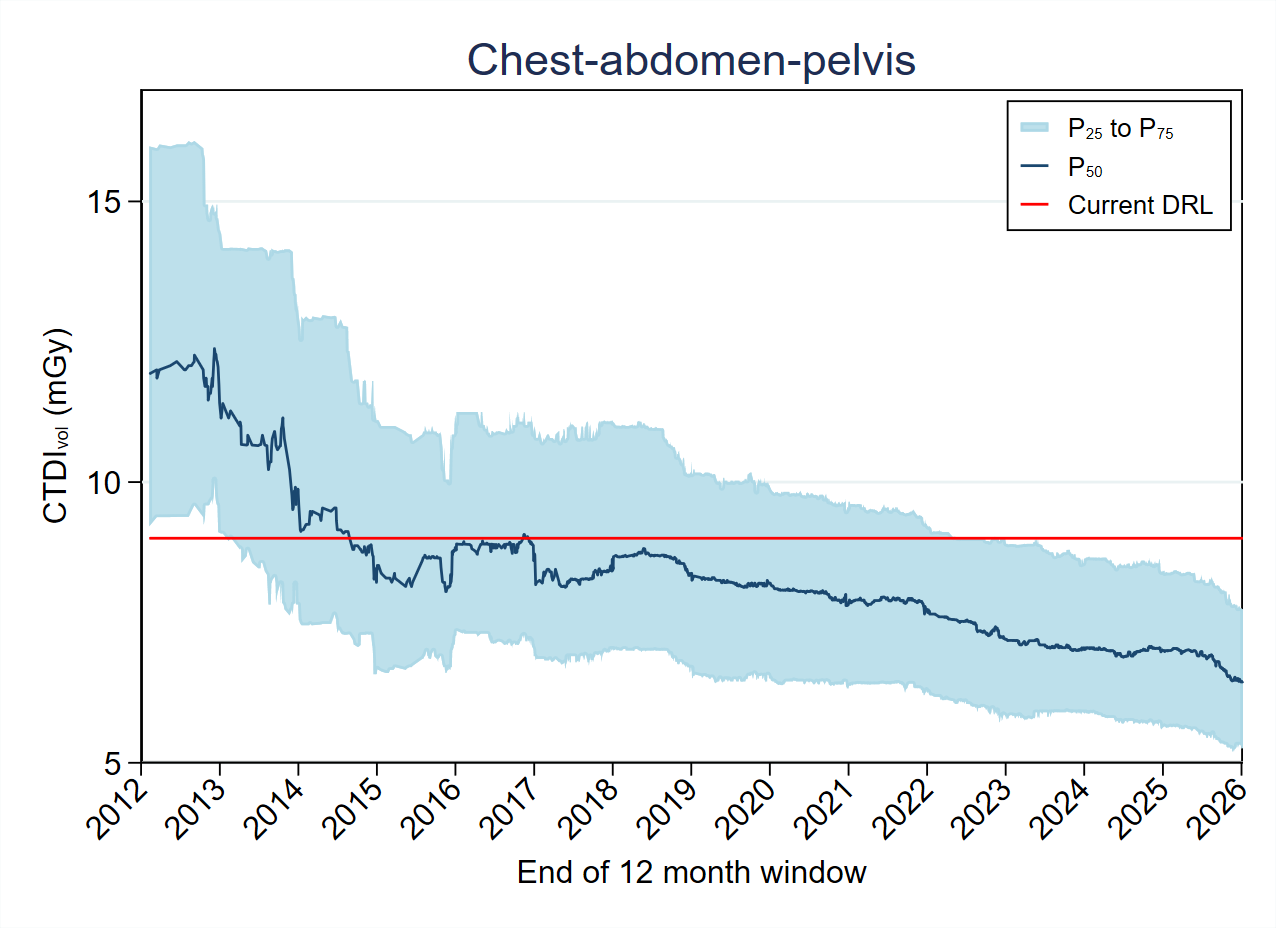
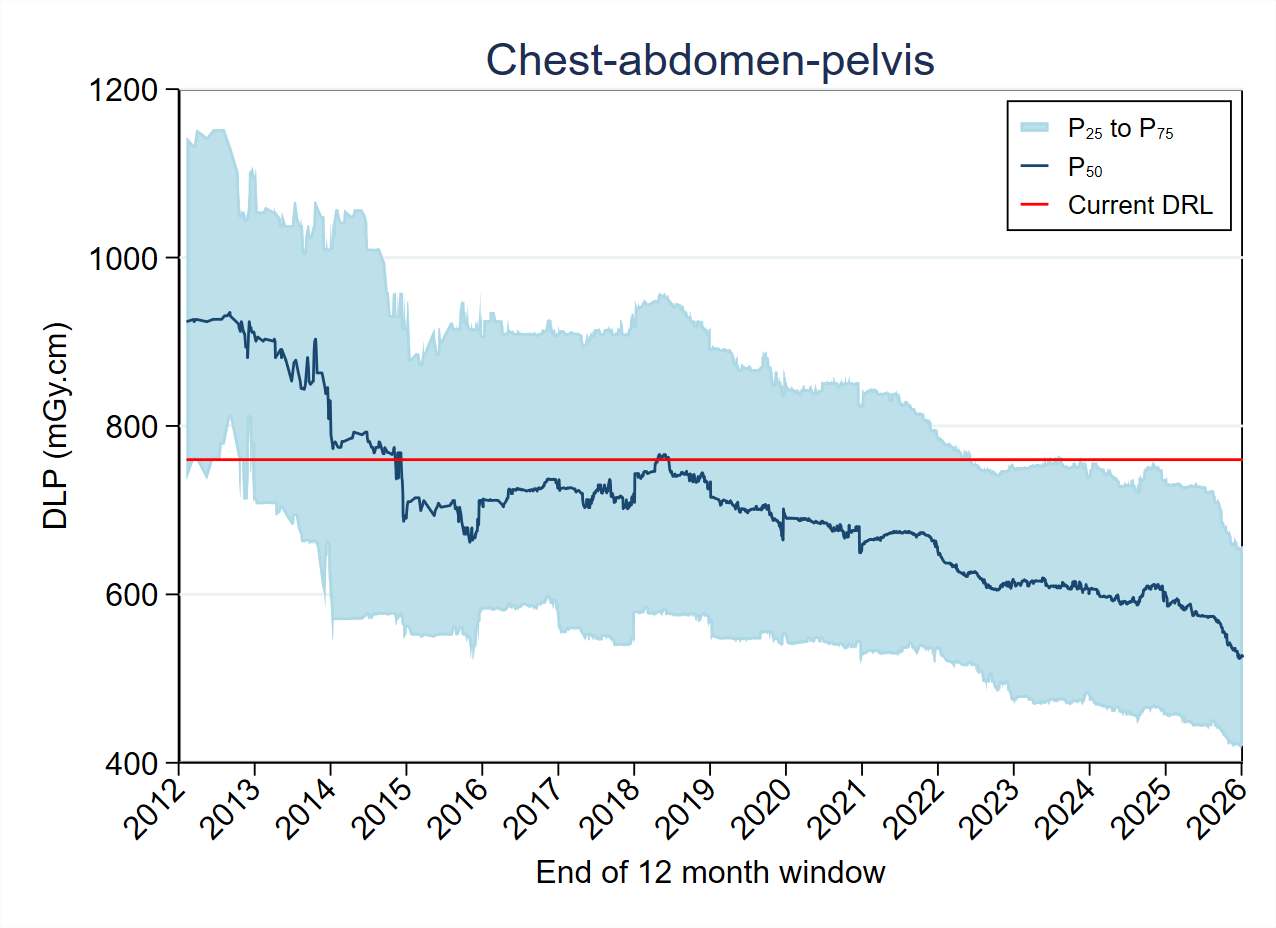
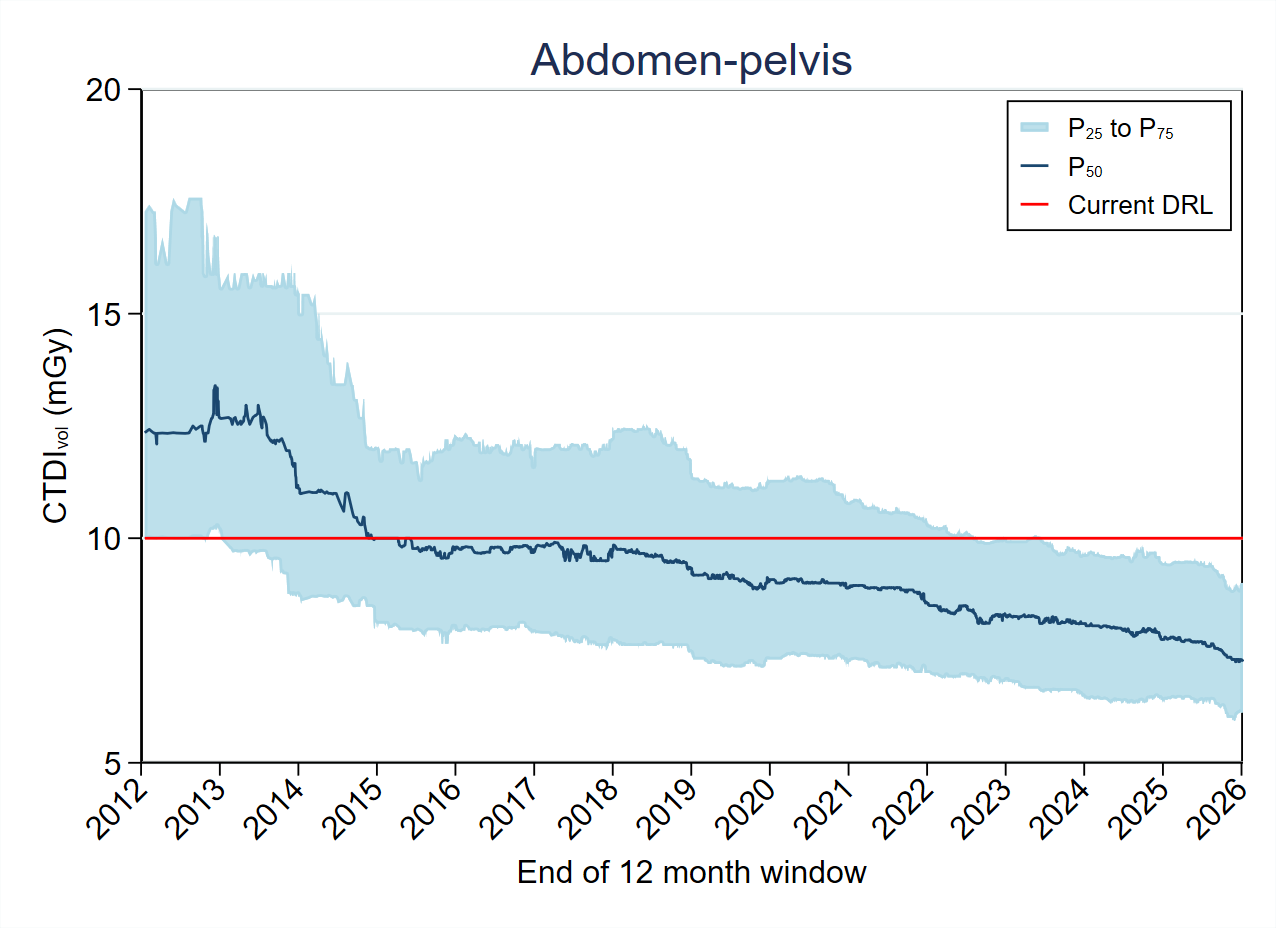
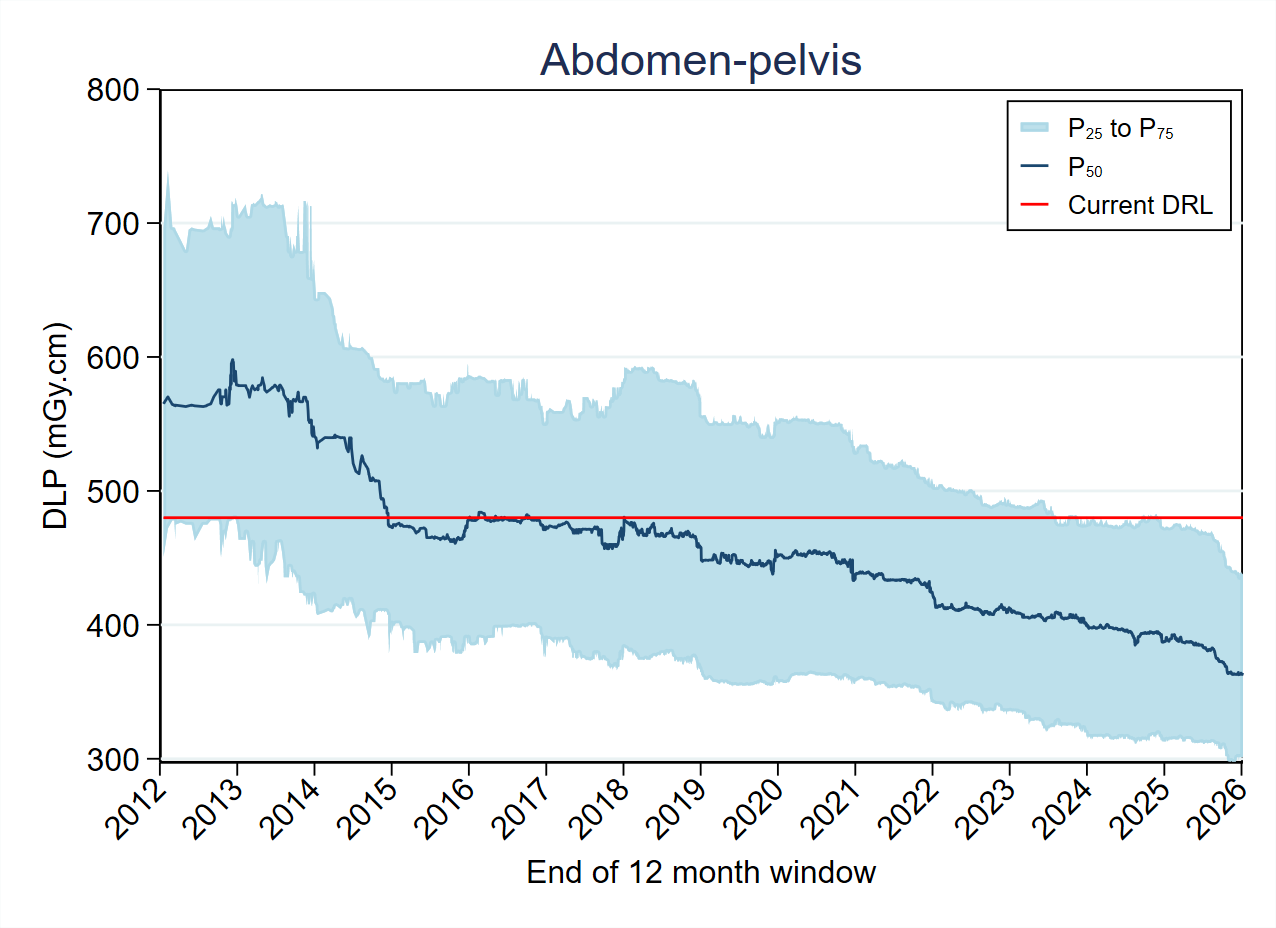
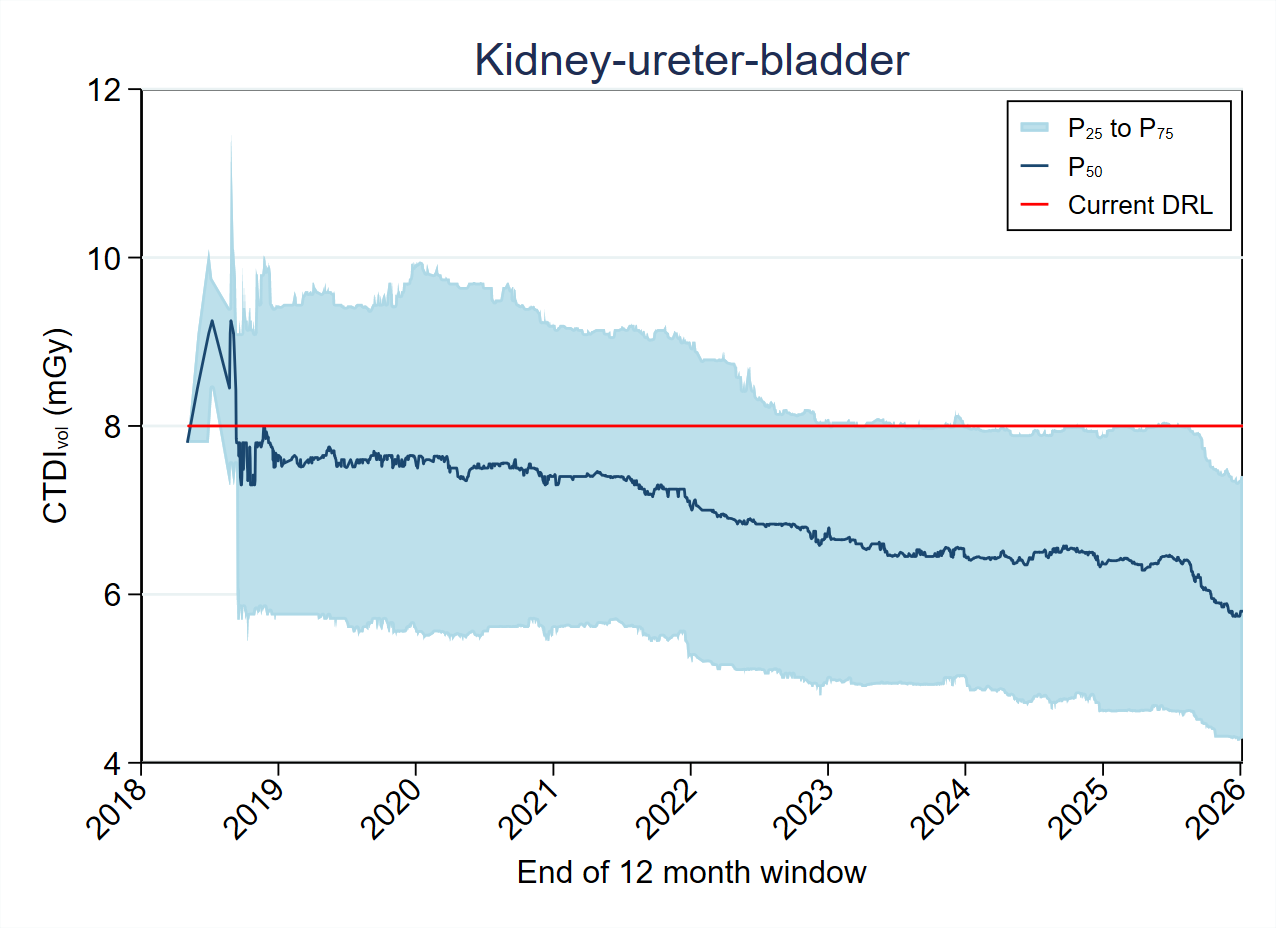
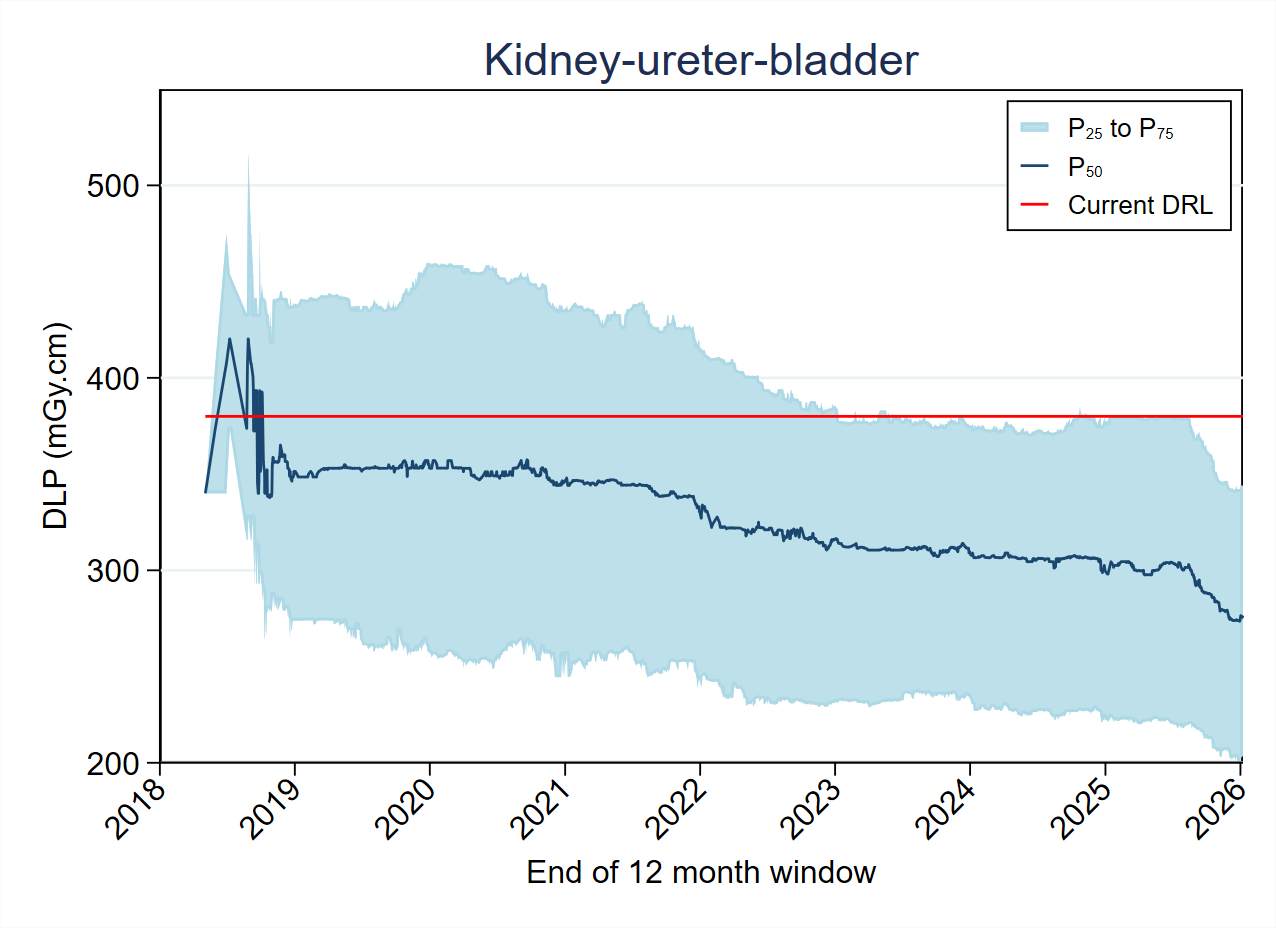
The curves below show the change in the median of the FRL distribution since the beginning of 2012 for different protocols. The graphs have been generated by examining the surveys submitted during a moving 12-month period, where the start and end points of the window have been shifted by daily intervals. The x-axis is the end date of the 12-month interval, the blue line is the median of the corresponding FRL distribution, the red line denotes the current DRL and the light blue region indicates the 25th– 75th percentile range.
Note that the cervical spine, KUB and soft-tissue neck data only go back to 2018 because these protocols were only added to the list of national DRLs and included in the data collection at that time. Paranasal sinus and low dose chest scans are omitted in the graphs below as these protocols were only recently added to the MDCT DRLs
Head
Soft-tissue neck
Cervical spine
Chest
Chest-abdomen-pelvis
Abdomen-pelvis
Kidney-ureter-bladder
Lumbar spine