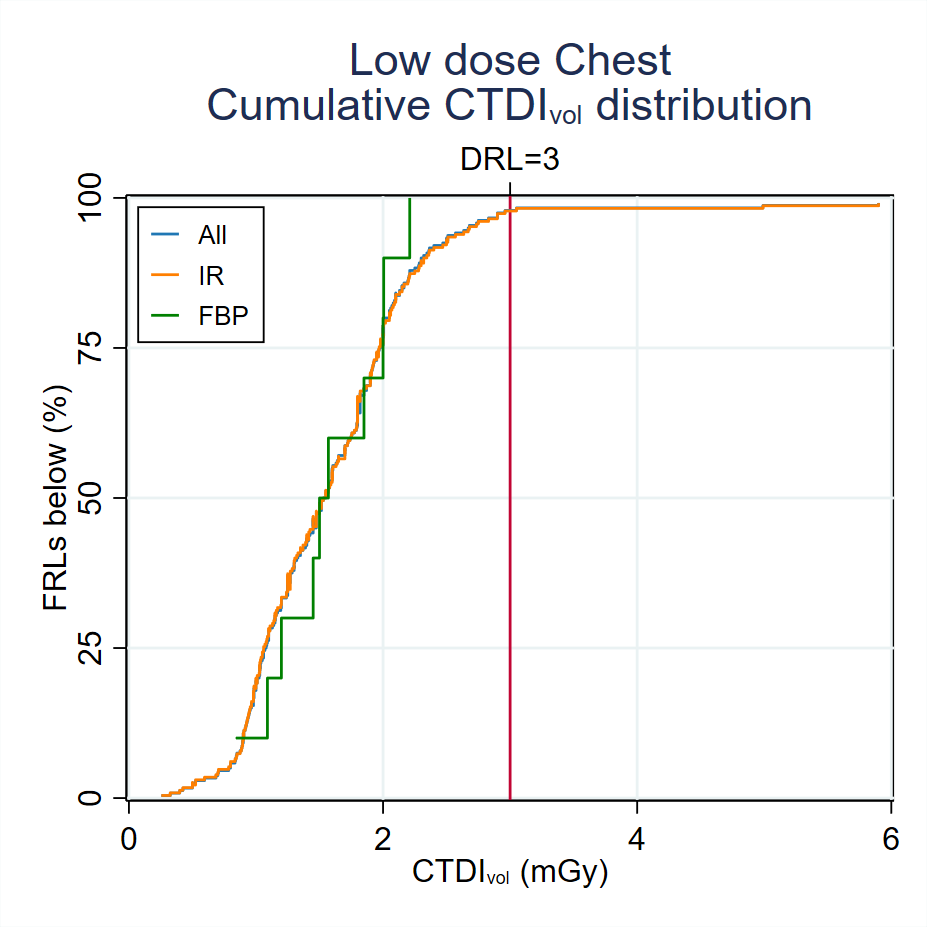
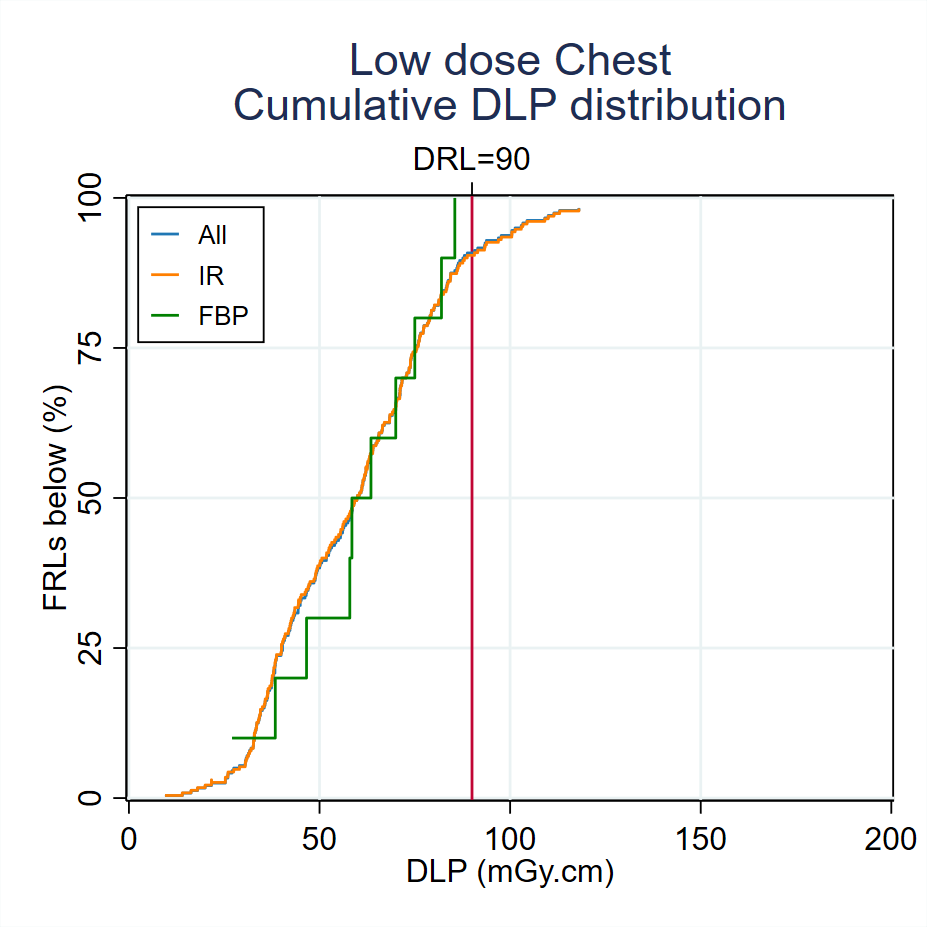
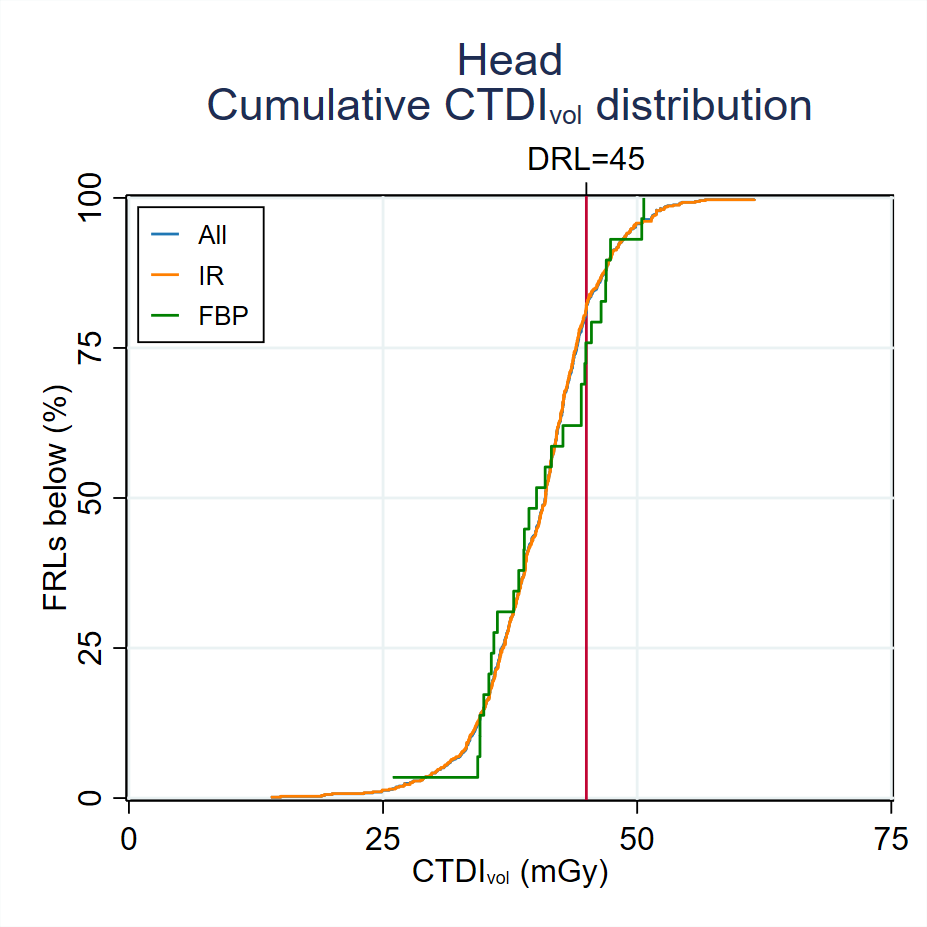
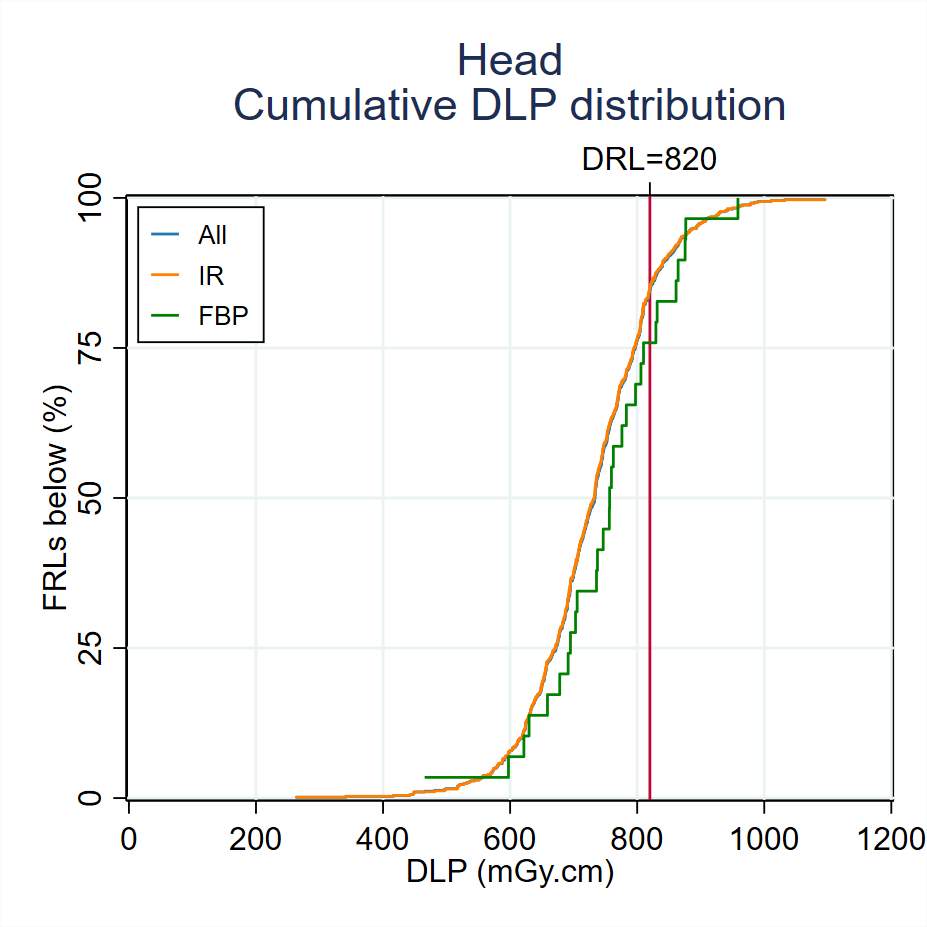
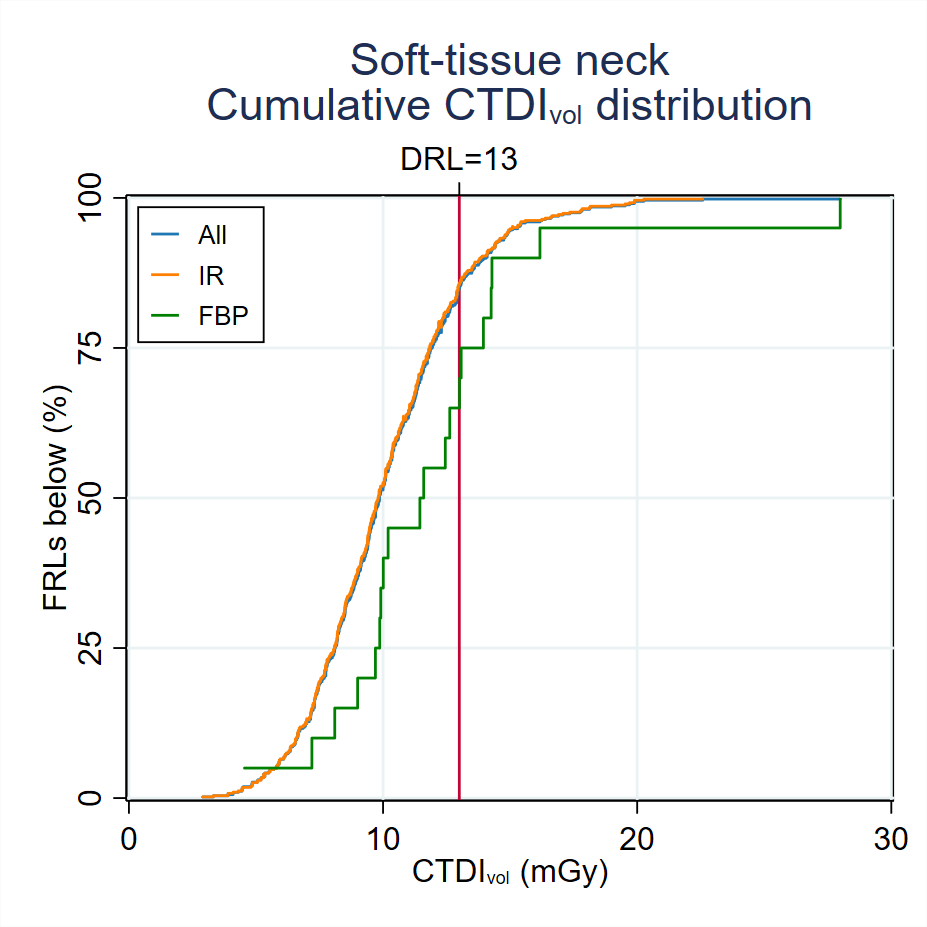
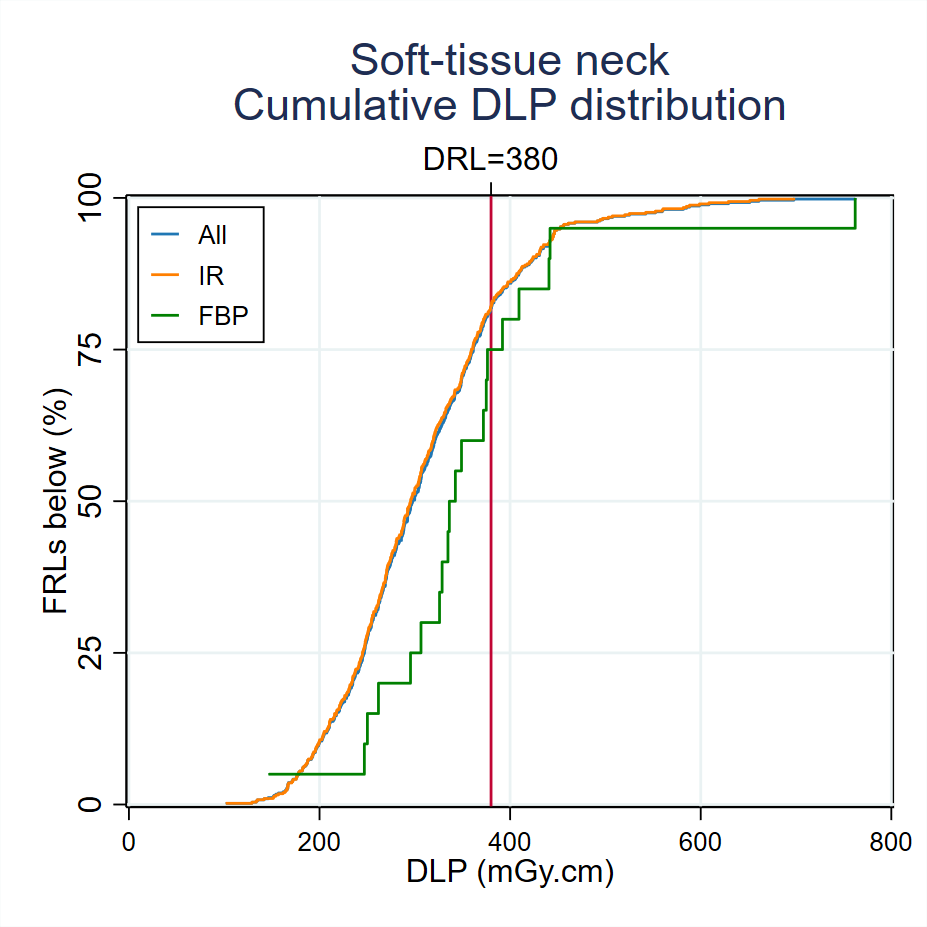
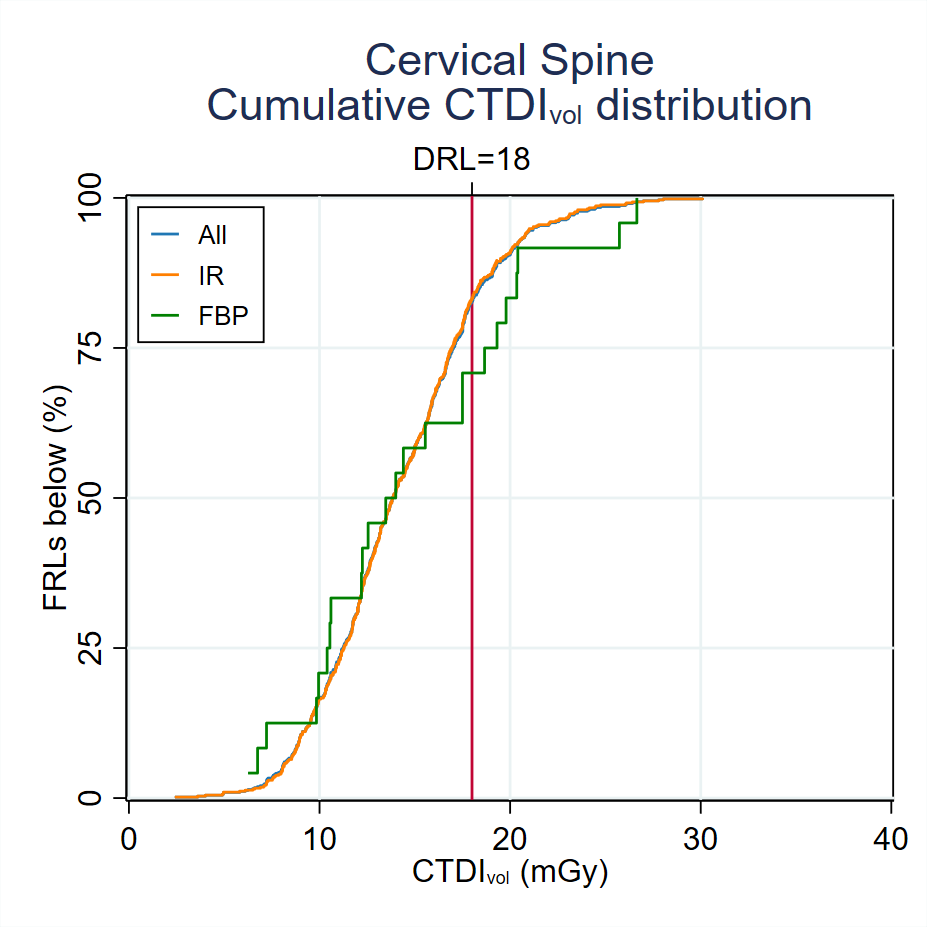
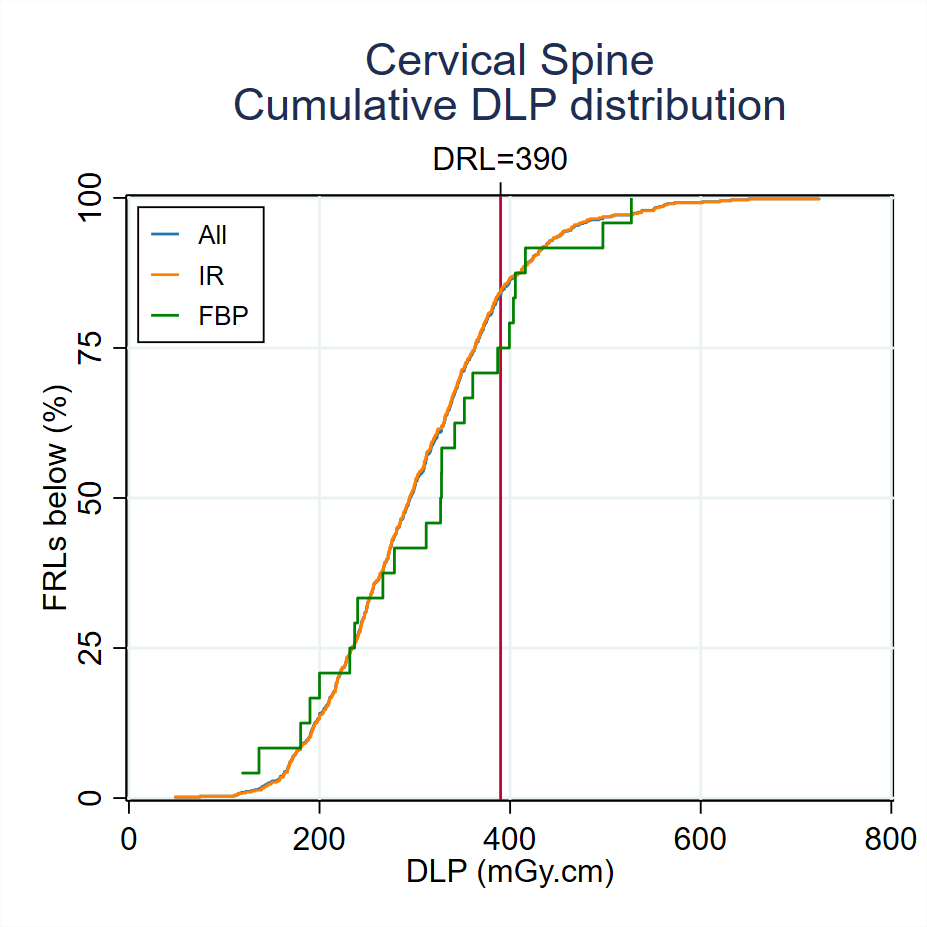
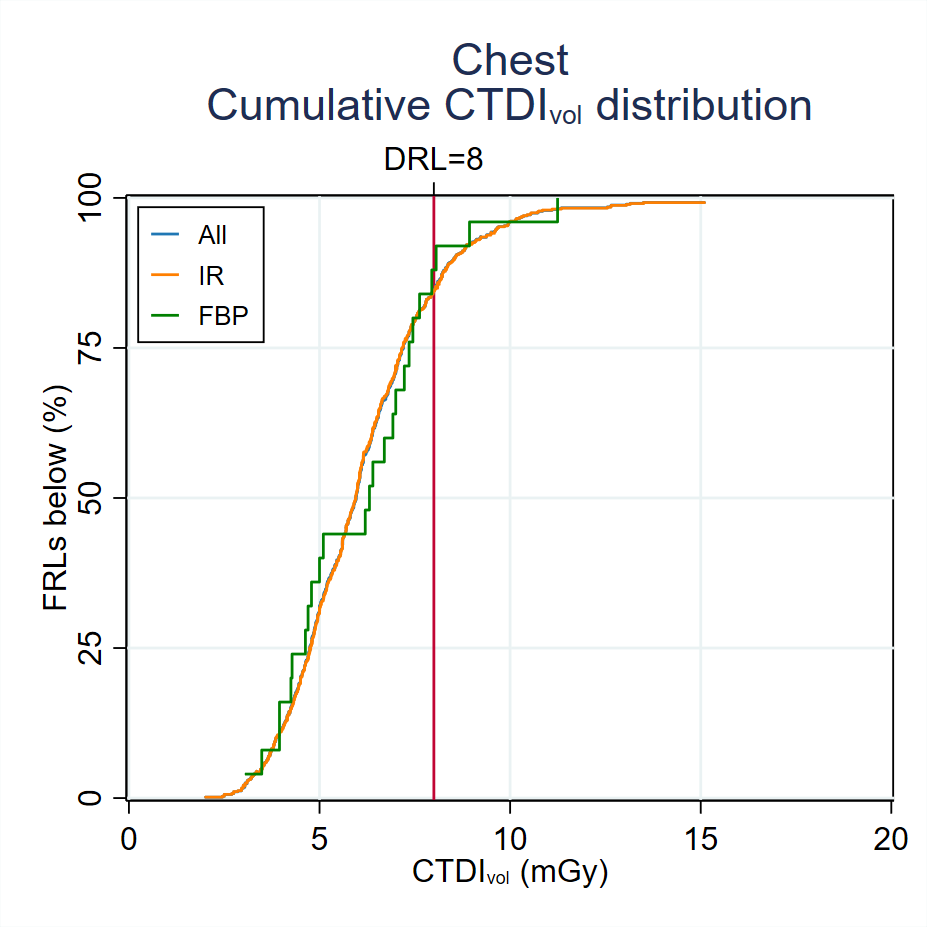
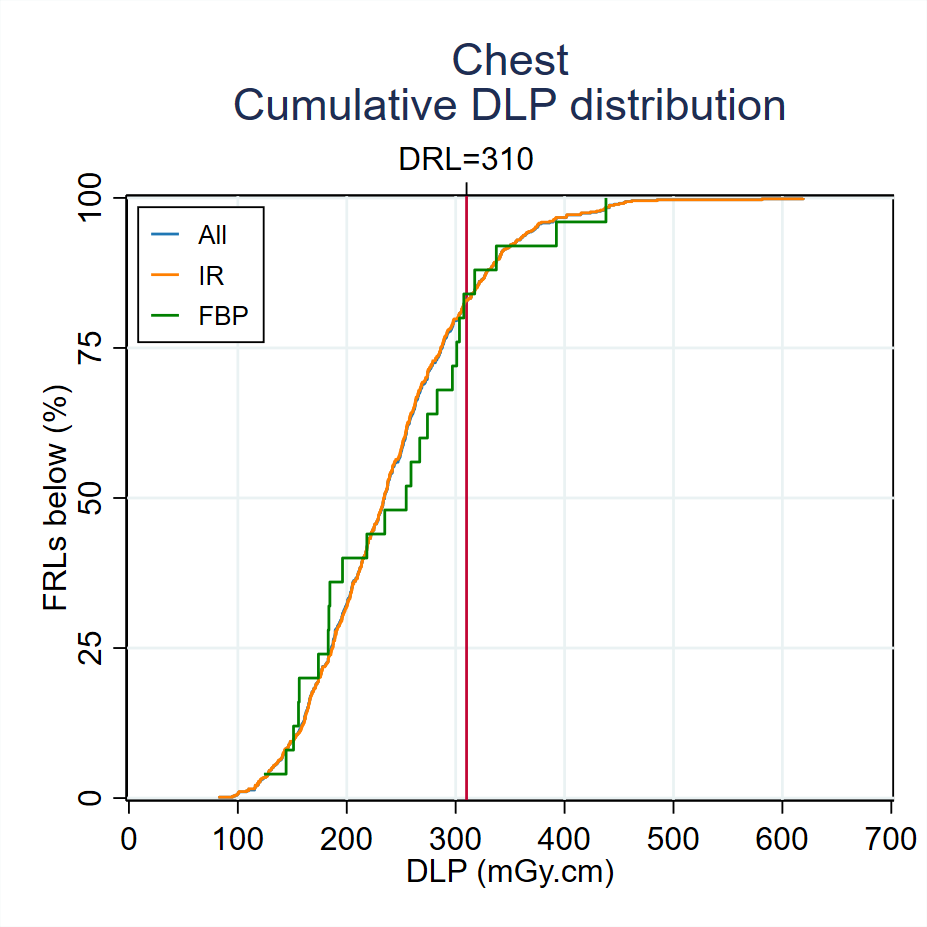
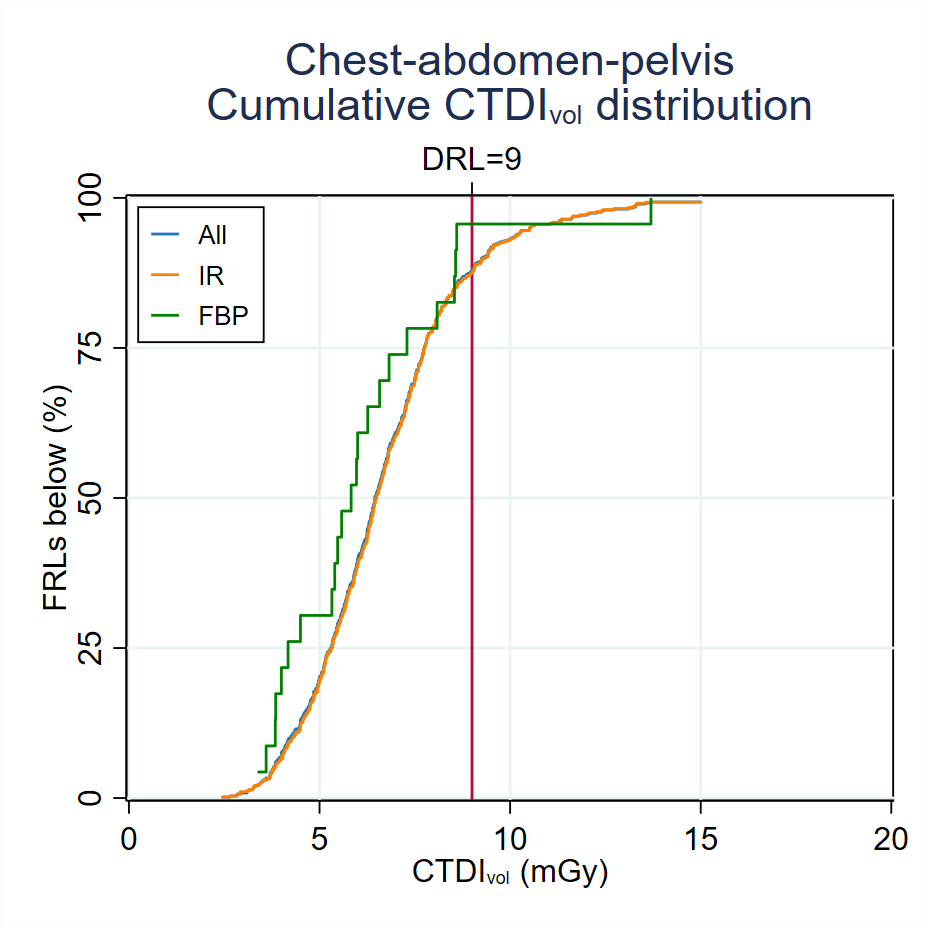
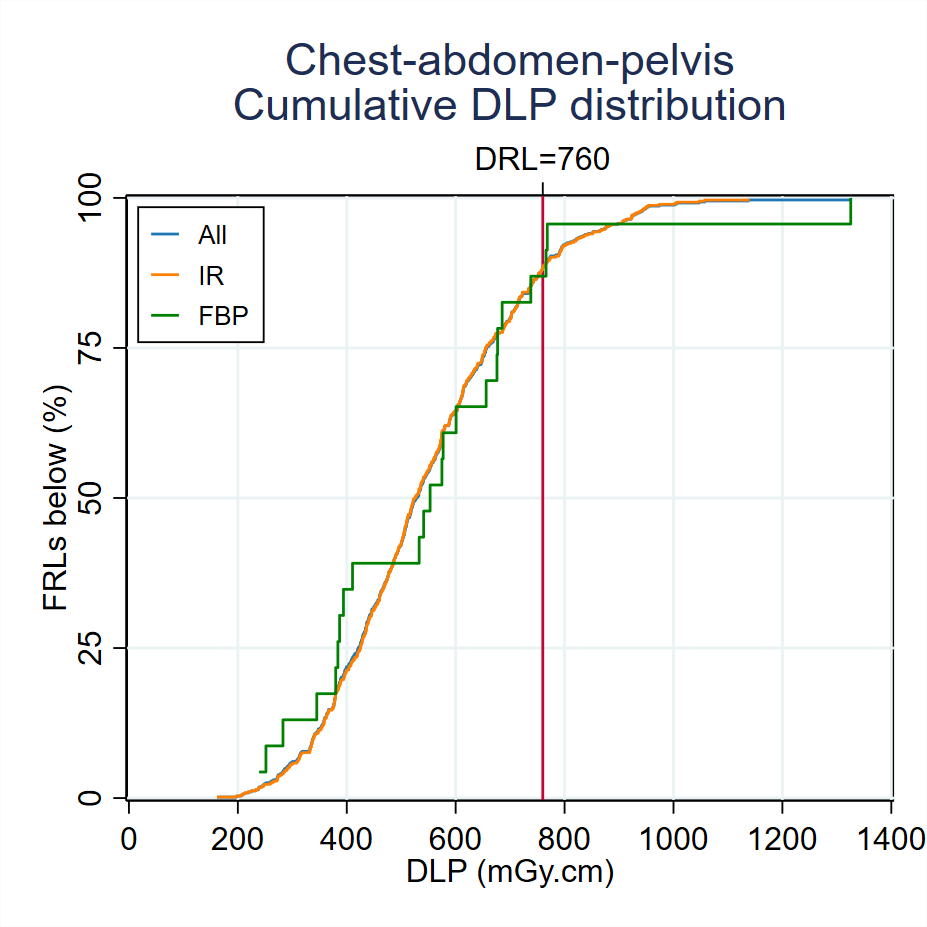
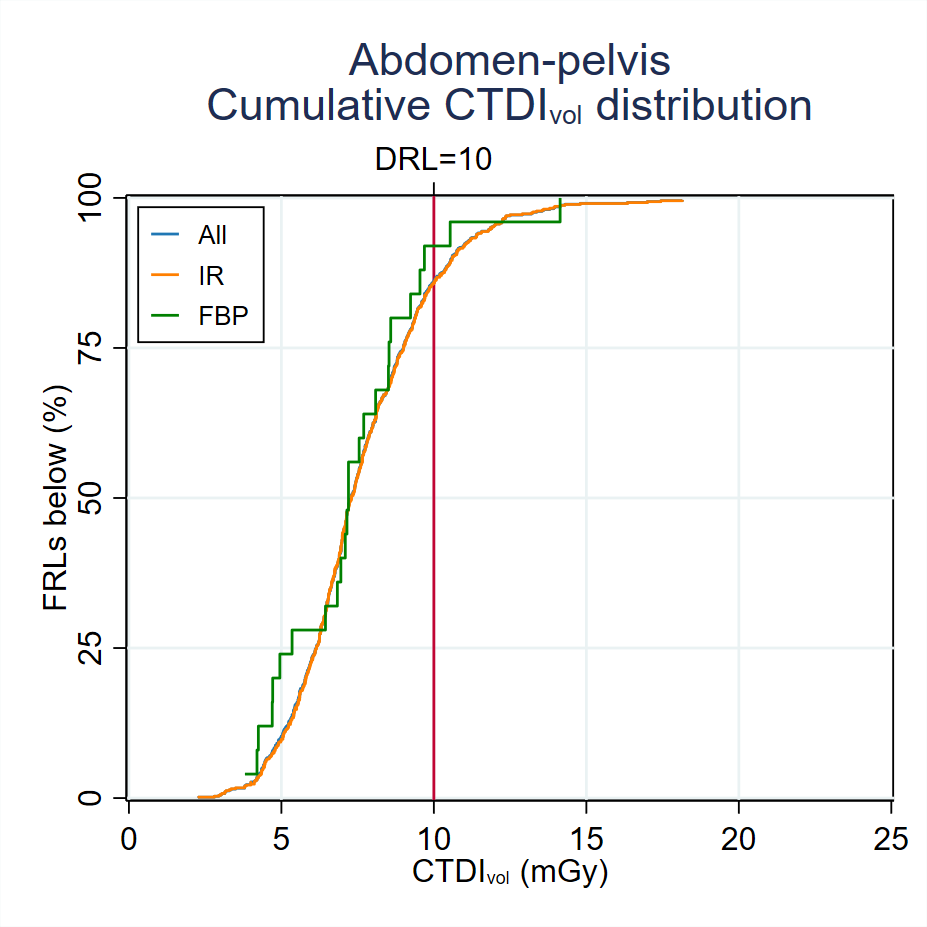
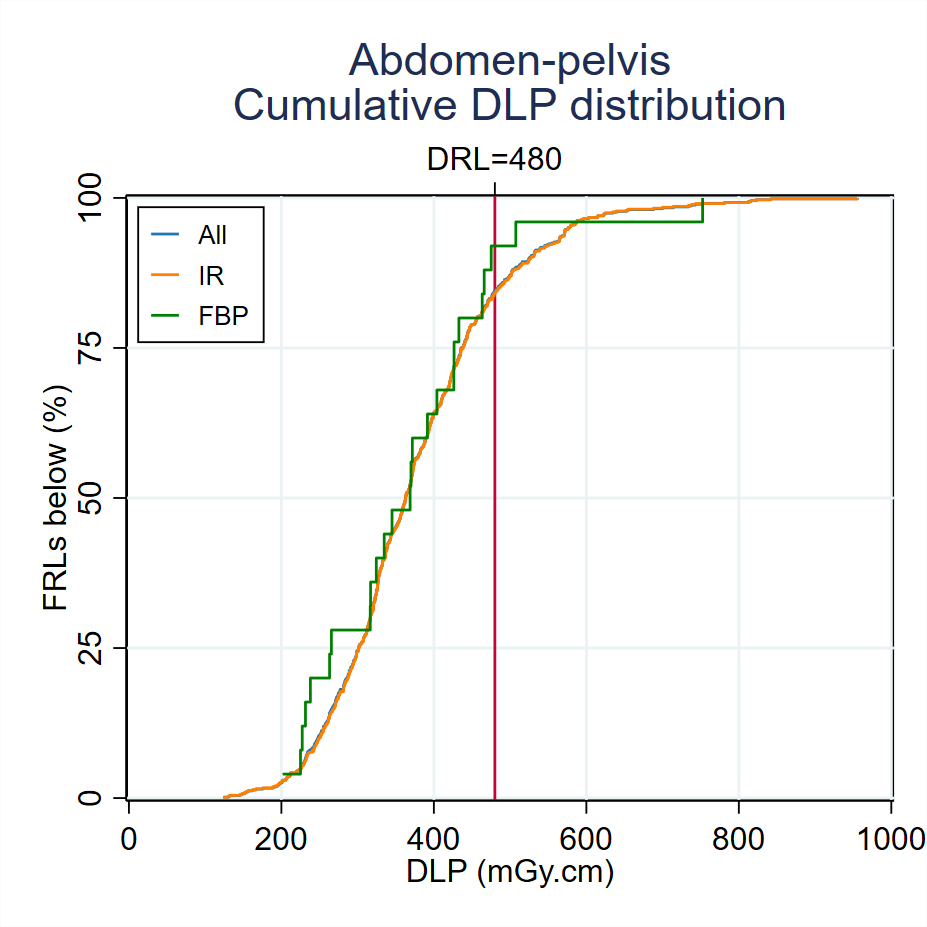
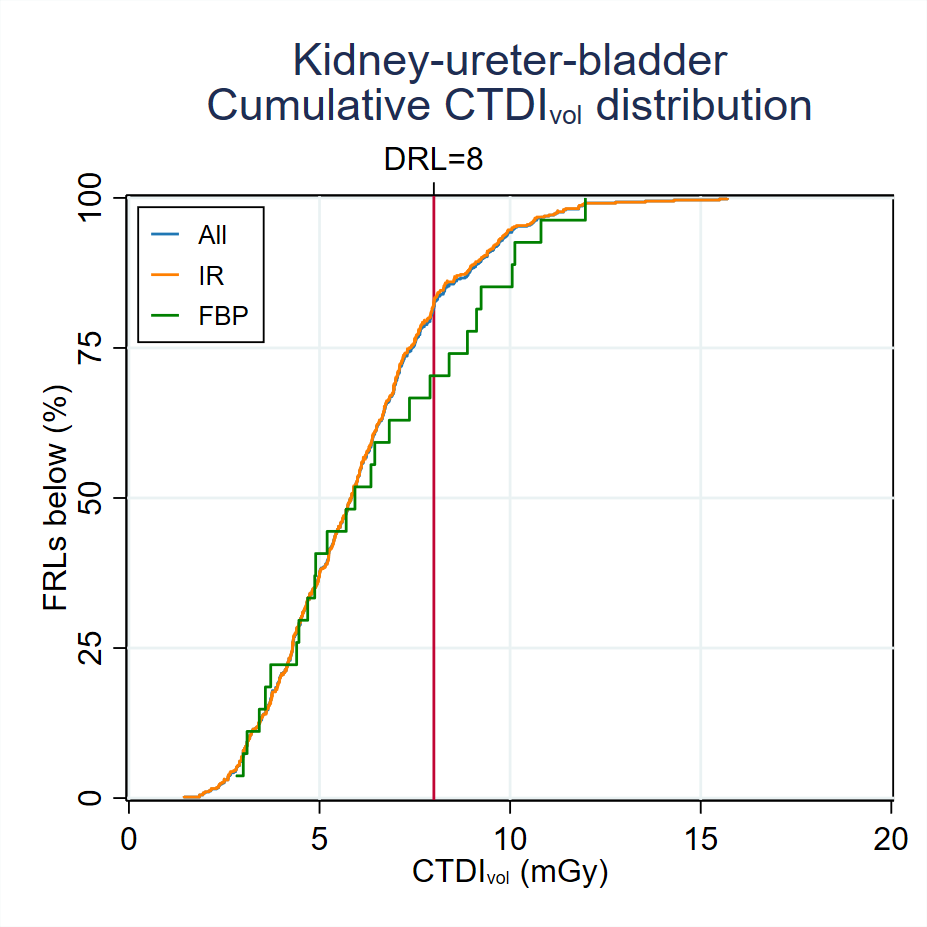
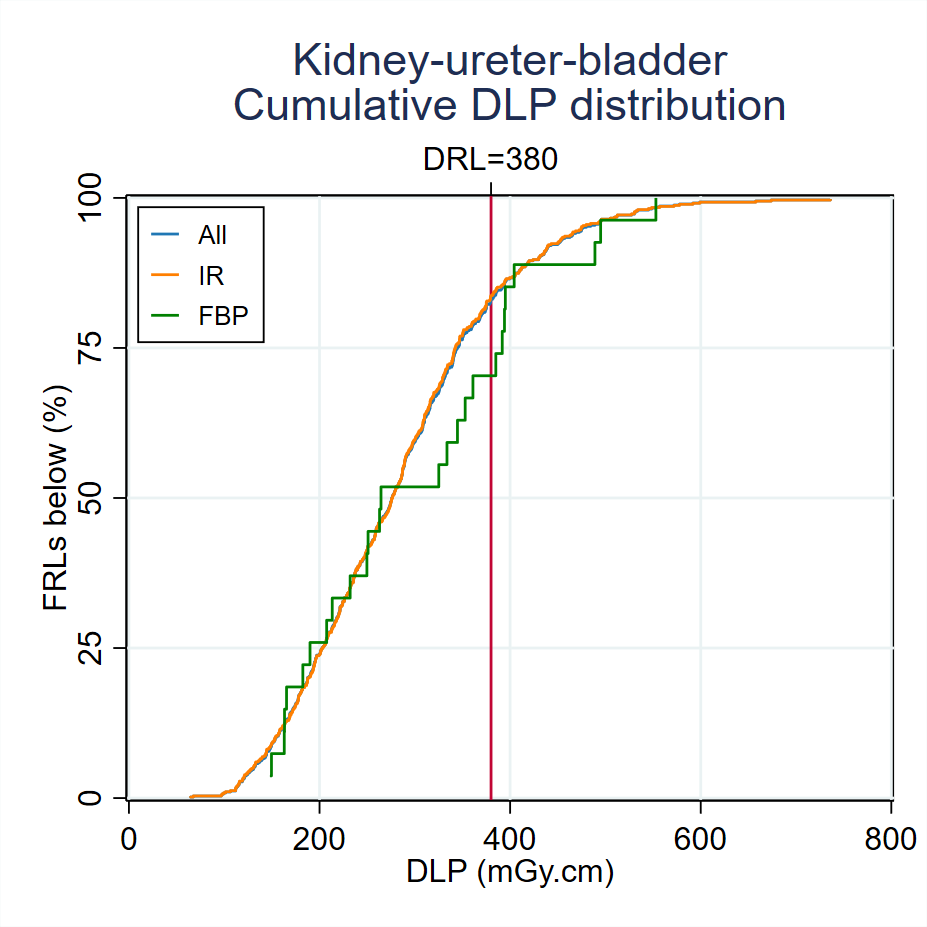
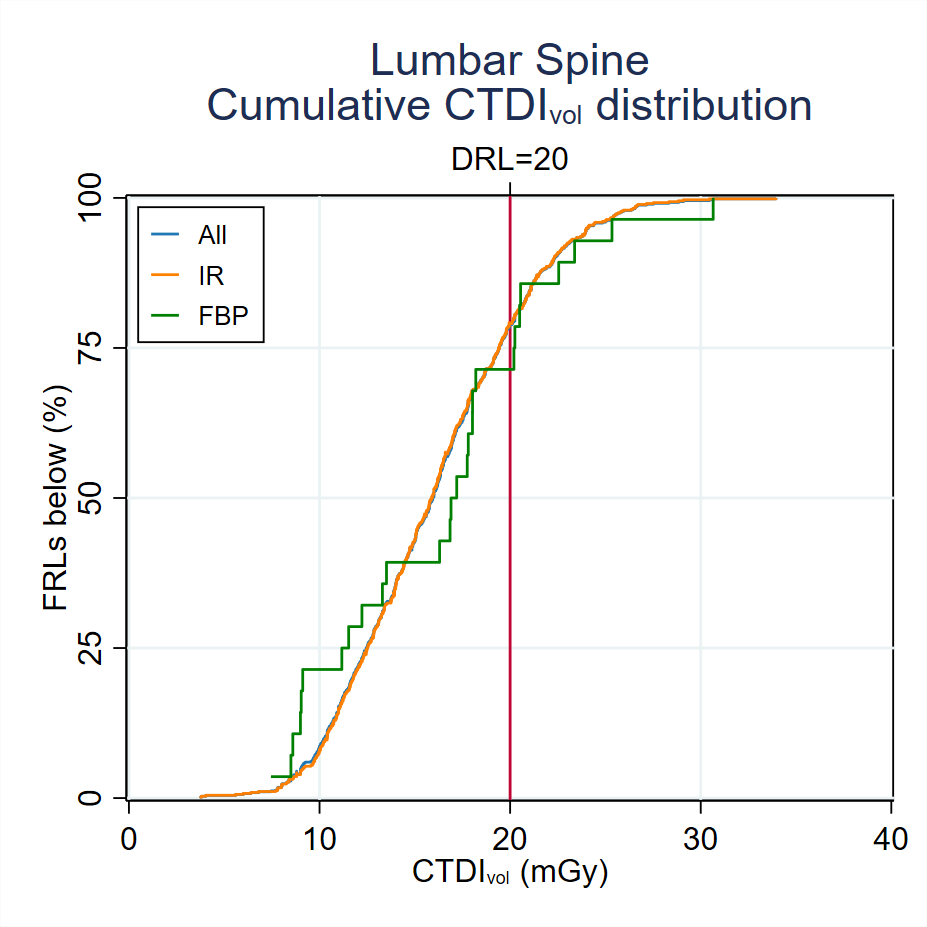
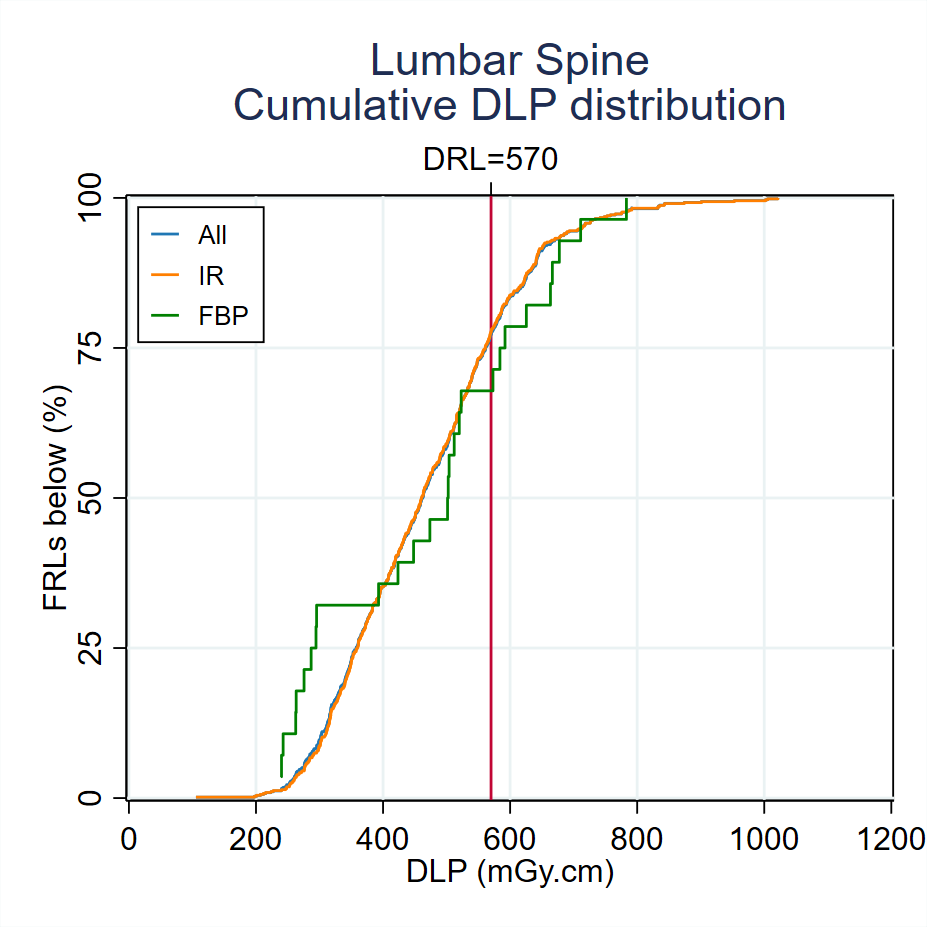
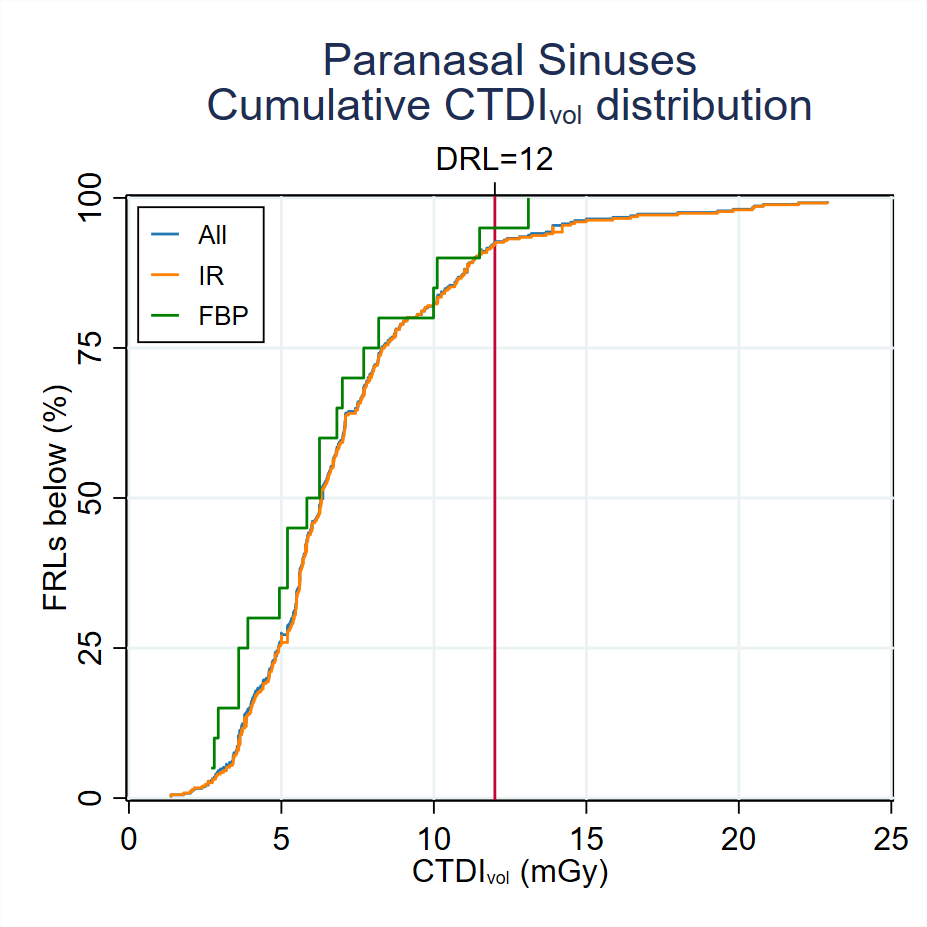
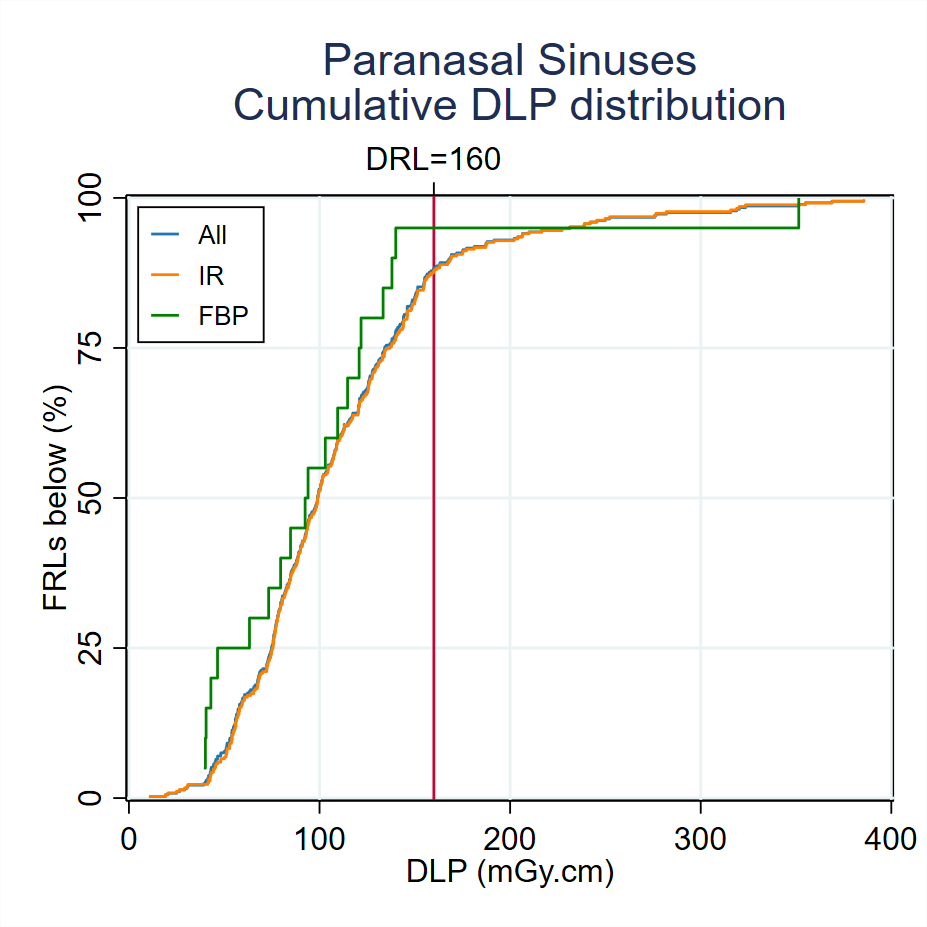
The curves below show the cumulative distributions for the DLP and CTDIvol from adult DRL surveys submitted to ARPANSA in 2025. The plots display the percentage of surveys that achieved a facility reference level (FRL) below the dose specified on the x-axis. The blue curve represents all of the submitted data, the orange curve represents the surveys where iterative reconstruction (IR) was used and the green curve represents the surveys where IR was not used. The present national DRL is represented by the vertical red line. The national DRL was derived from data submitted in earlier years and, consequently, the DRLs do not match the 75th percentile of the plotted distributions.
Head
Soft-tissue neck
Cervical spine
Chest
Chest-abdomen-pelvis
Abdomen-pelvis
Kidney-ureter-bladder
Lumbar spine
Paranasal Sinuses
Low dose chest