Last revision date: 23 September 2024
Formats of data
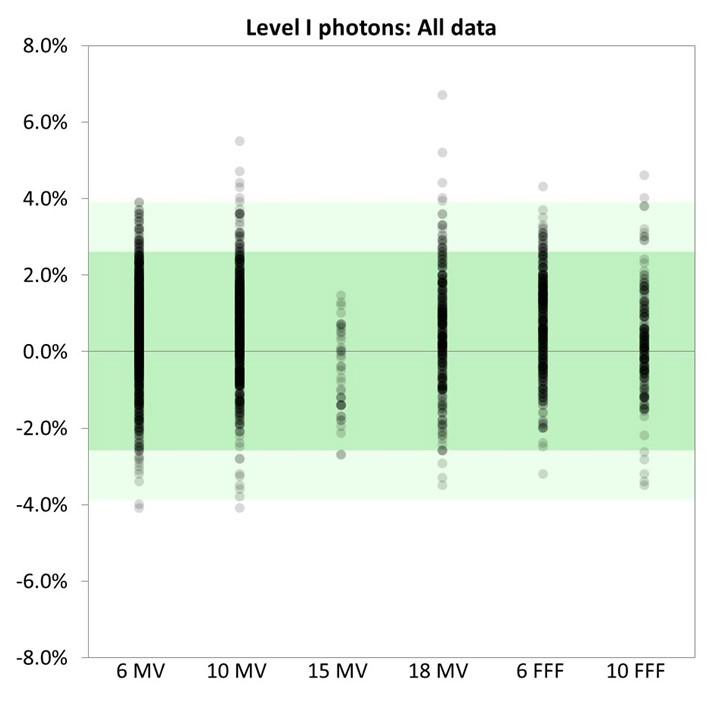
The data for each level is shown in two formats:
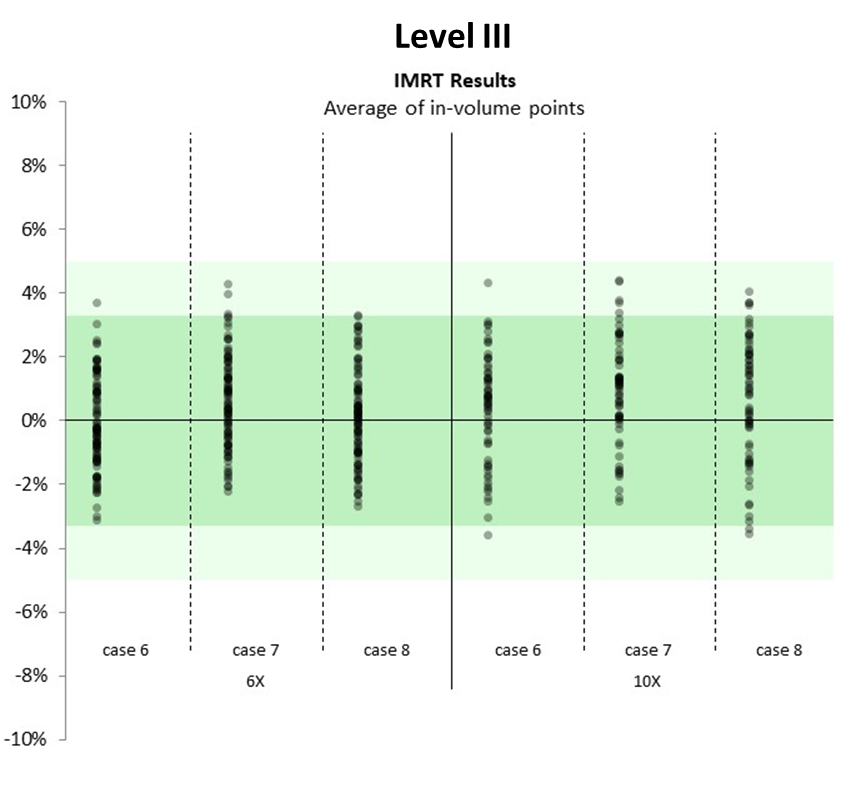
- the individual data points are shown and the averages with error bars representing two standard deviations
- the darker green area represents the Pass (Optimal) threshold and the lighter green is Pass (Action)
- the white area is Out of Tolerance.
Example:
ACDS Australia and New Zealand Datasets | ||||
|---|---|---|---|---|
| Level I | Photons | All data | Data statistics | |
| Electrons | All data | Data statistics | ||
| Level Ib | Photons | All data | Data statistics | |
| Electrons | All data | Data statistics | ||
| Small field OF's | All data | |||
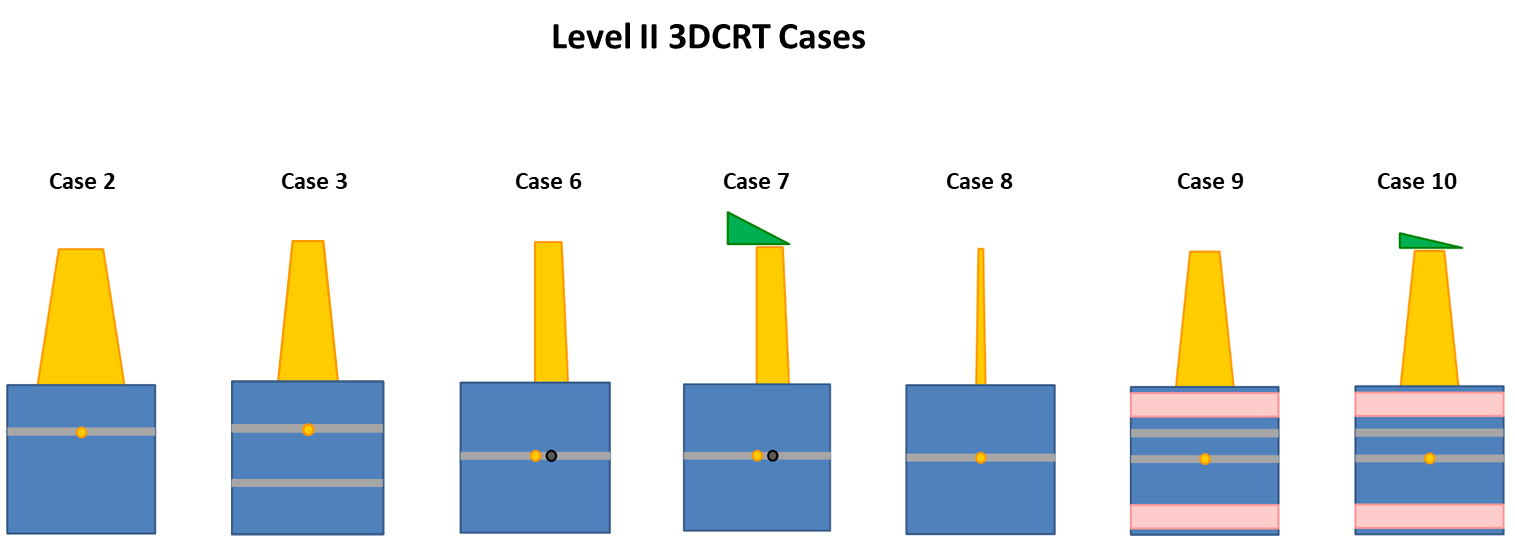
| Level II | 3DCRT | Case descriptions | Dose to water | Dose to water |
Dose to medium | Dose to medium | |||
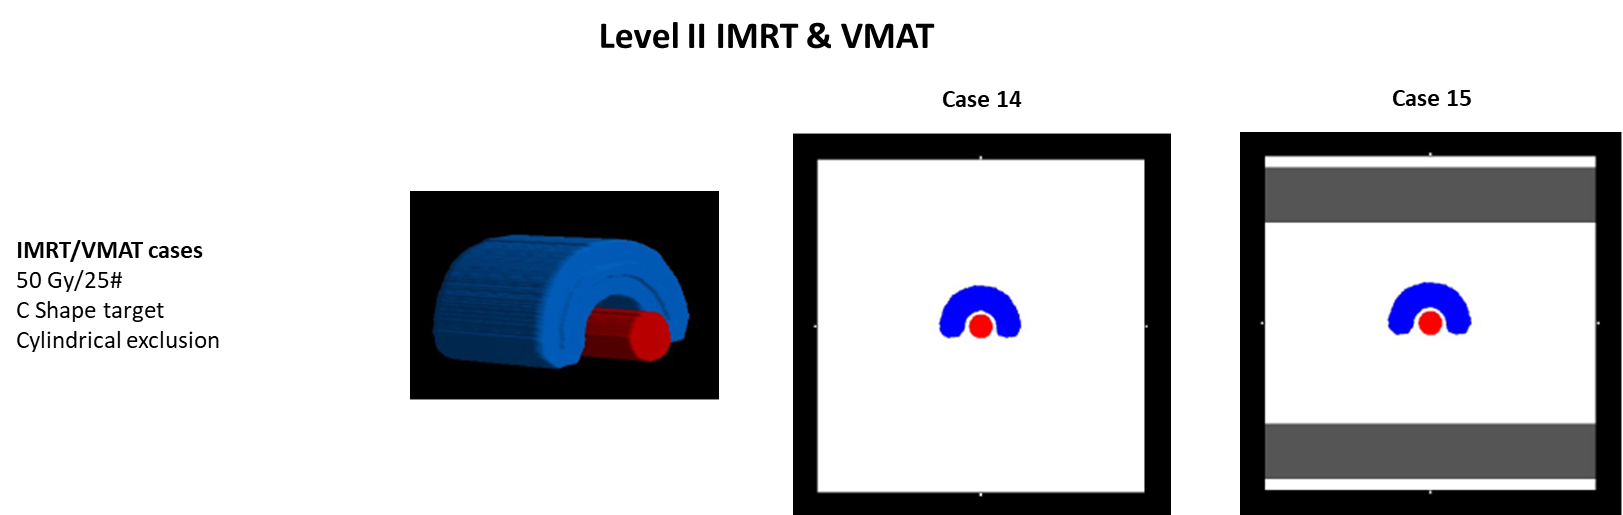
| IMRT and VMAT | Case descriptions | Dose to water | Dose to water | |
Dose to medium | Dose to medium | |||
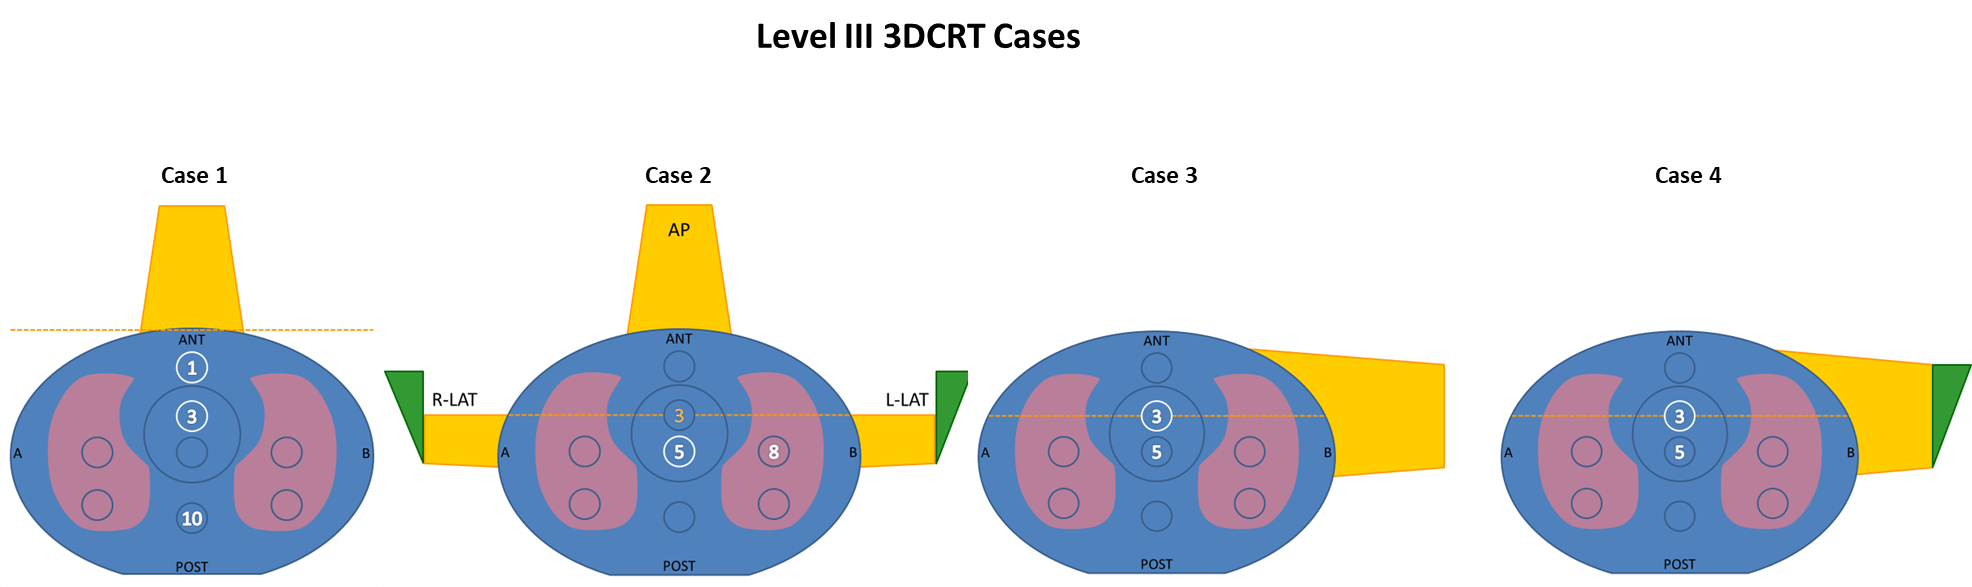
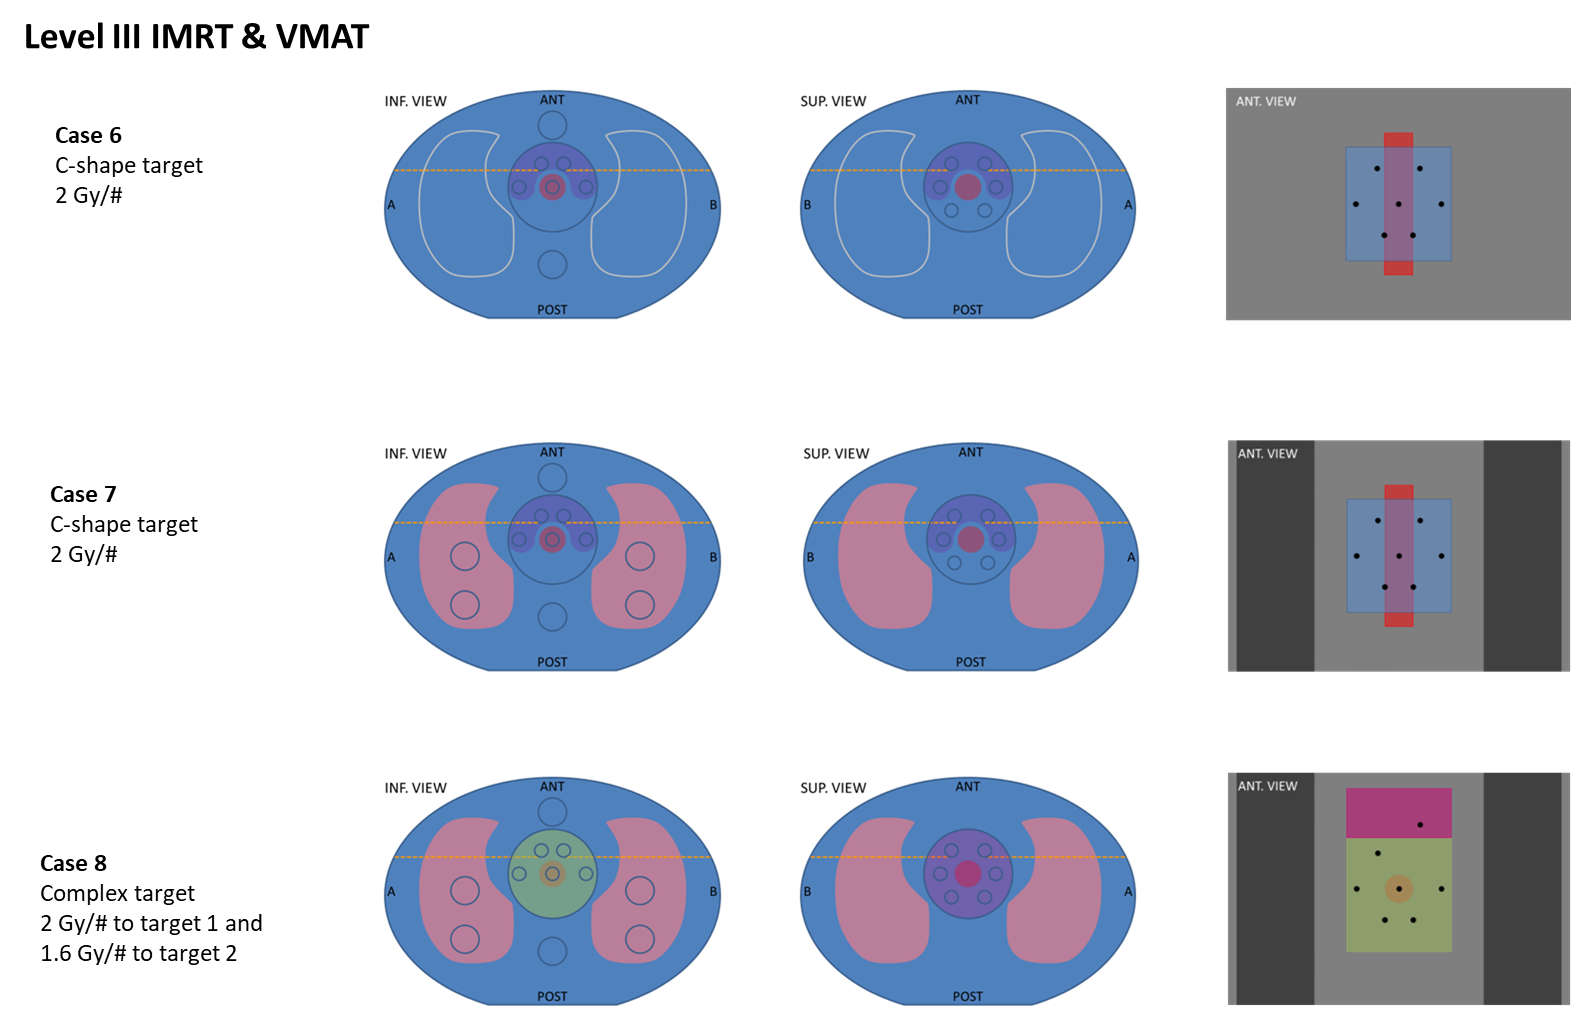
| Level III | 3DCRT | Case descriptions | All data | |
| IMRT | Case descriptions | All in-volume data | Average in-volume data | |
| IMRT FFF | All in-volume data | Average in-volume data | ||
| VMAT | All in-volume data | Average in-volume data | ||
| VMAT FFF | All in-volume data | Average in-volume data | ||
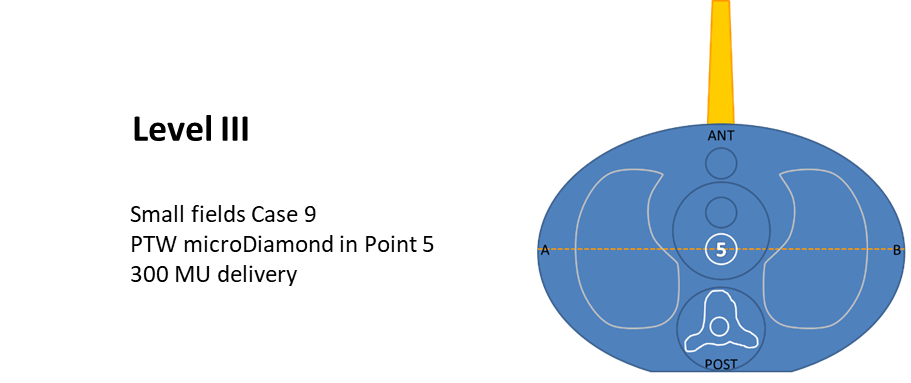
| Small fields | Case descriptions | All data | ||
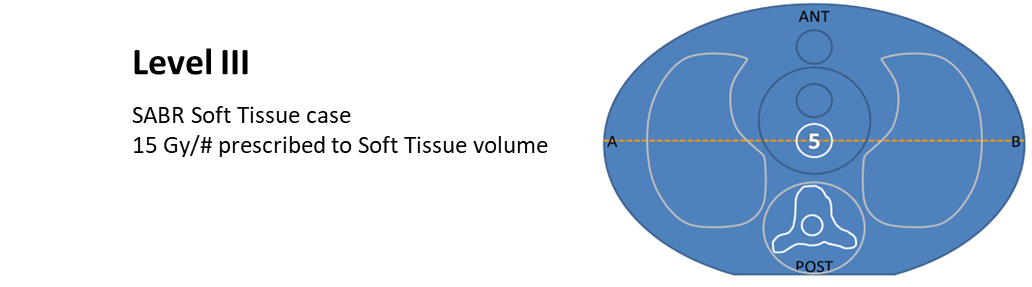
| SABR Soft Tissue | Case descriptions | All data | ||
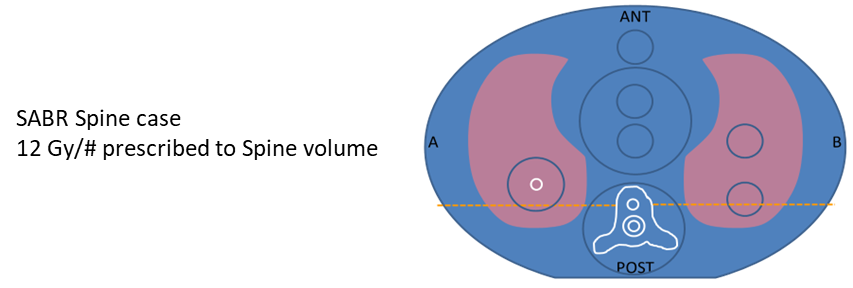
| SABR Spine | Case descriptions | All data | ||
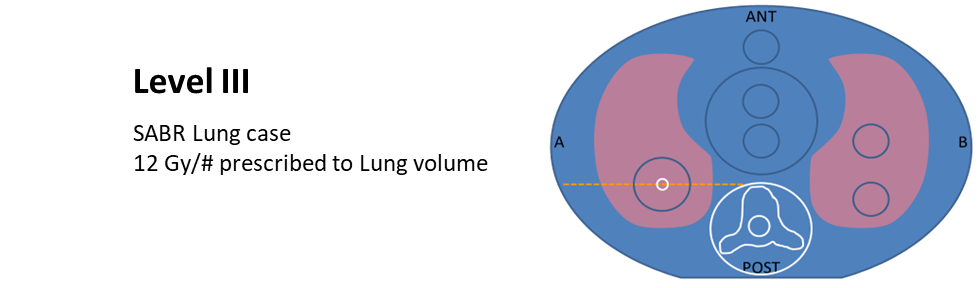
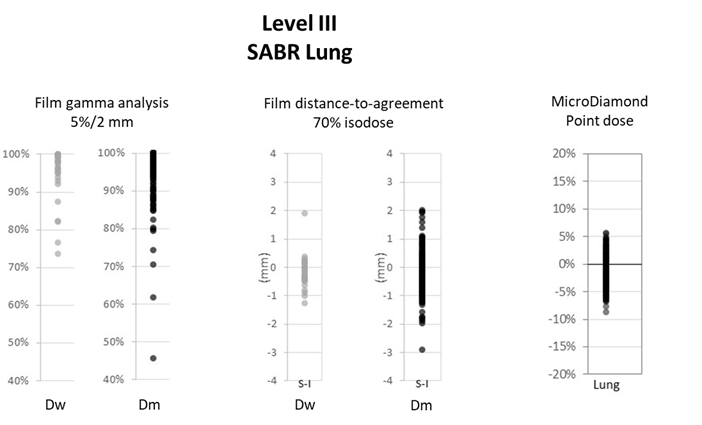
| SABR Lung | Case descriptions | All data | ||


